Multi-Period Resonance — 3 coins, 30-minute timeframe. 4-hour moving averages in bullish alignment, diverging upward 🔥
════════════════════
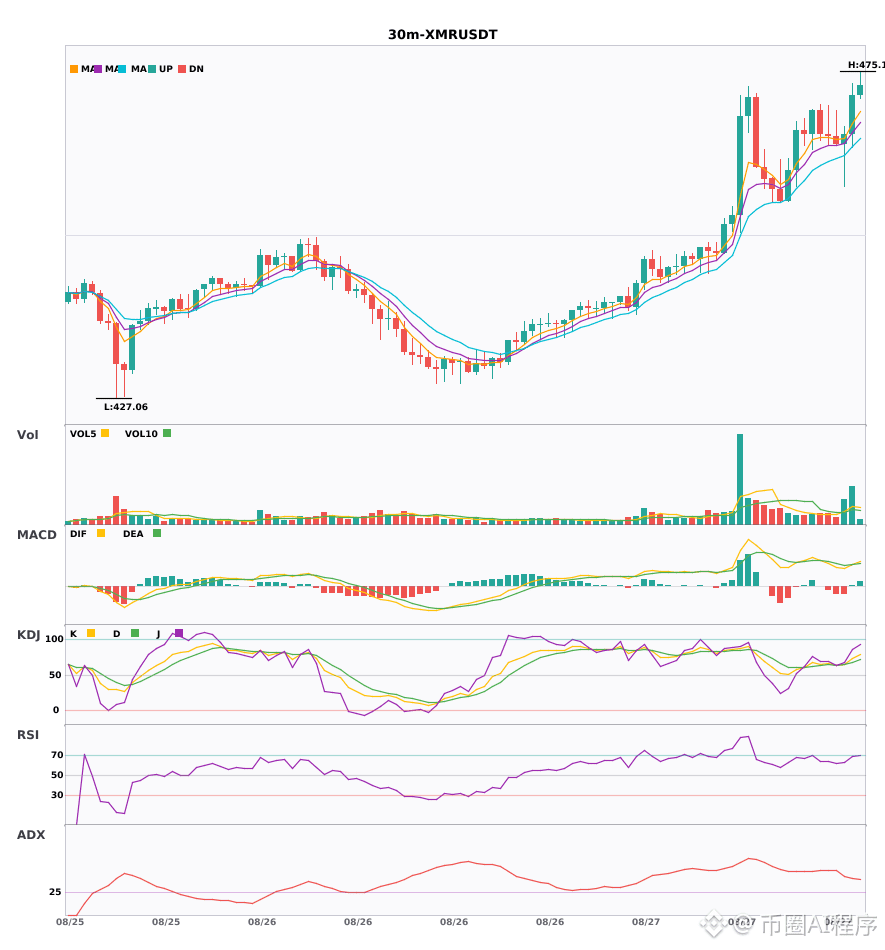
🔴 $XMR 30 minutes — Bullish signal
⚠️ Technicals: On the 4-hour chart, the bigger direction is bullish—trade along the daily trend! On the 30-minute MACD, a golden cross forms above the zero line, and the histogram bars are getting longer, showing strong bullish momentum. The 5, 8, and 13 moving averages are arranged bullishly and dispersing upward. KDJ’s K is in the 73 strong zone, with D at 67—bulls are in control, and volume has increased too. You can enter.
════════════════════
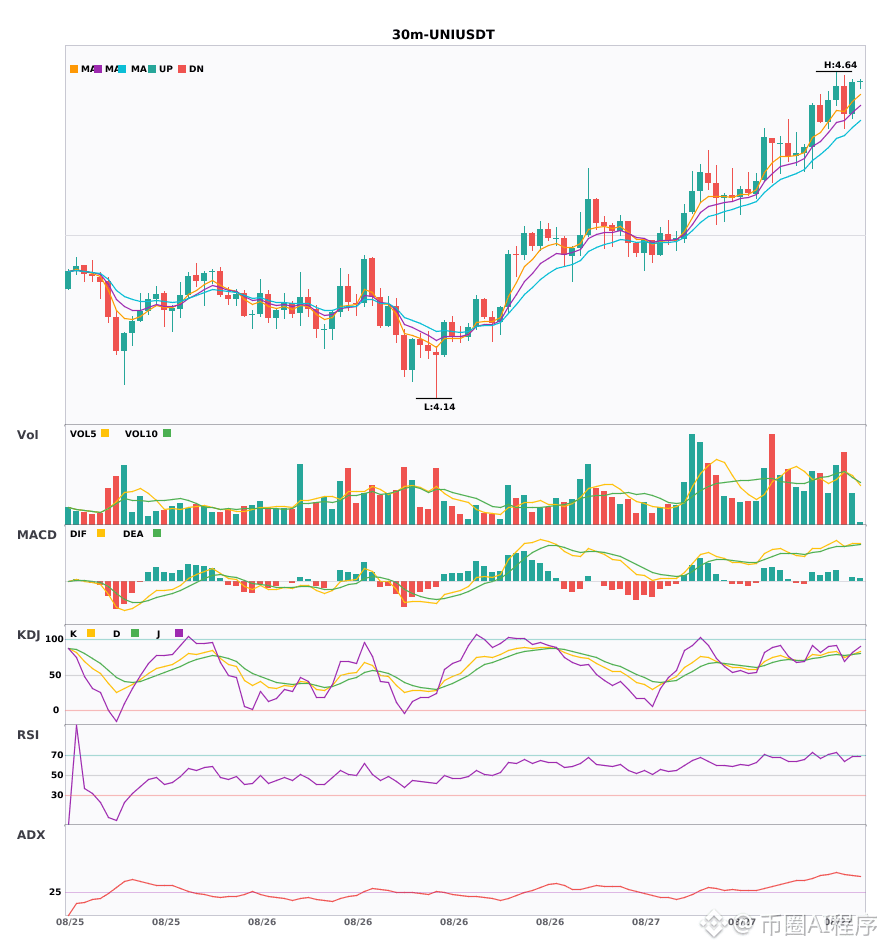
🔴 $UNI 30 minutes — Bullish signal
⚠️ Technicals: Confirm the bullish bias on the 4-hour chart! On the 30-minute MACD, a bullish golden cross above zero with increased volume—the red bars are getting longer, and the bulls are gaining strength. The moving averages (5 crossing 8 and 13) have just formed a bullish arrangement dispersing upward. KDJ golden cross with K at 79, still not yet in the overbought zone, so the short-term setup can still follow through. Volume is also at about 1.4x, and with multi-period resonance together, the upside signal is relatively steady.
════════════════════
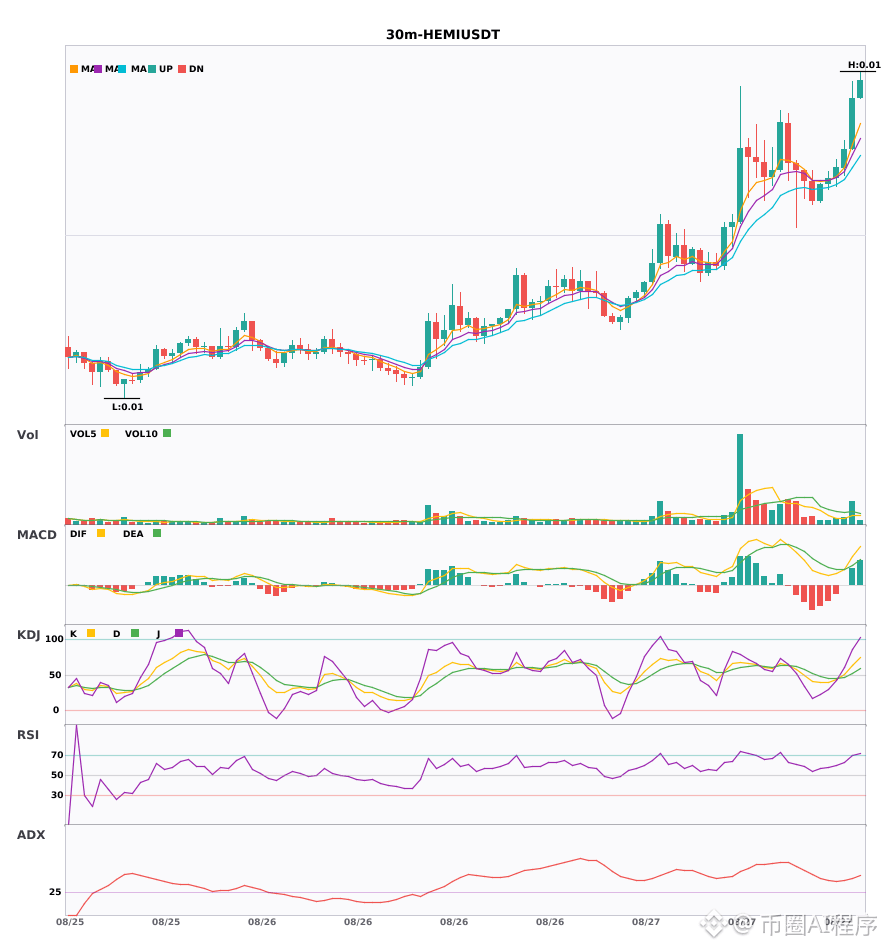
🔴 $HEMI 30 minutes — Bullish signal
⚠️ Technicals: 4-hour bigger trend is slightly bullish and confirms with resonance. On the 30-minute MACD, a golden cross above zero with increased volume—red histogram bars lengthen. The moving averages are bullish and dispersing. KDJ golden cross with K at 63 is not overbought; volume has expanded to nearly double, so you can go long along the trend.
════════════════════
🔔 Watch for the first-hand market moves and anomalies 🔔
#多周期共振 #XMR #UNI #HEMI
📌 When trading, pay attention to whether the candlestick patterns match
════════════════════
🔴 $XMR 30 minutes — Bullish signal
⚠️ Technicals: On the 4-hour chart, the bigger direction is bullish—trade along the daily trend! On the 30-minute MACD, a golden cross forms above the zero line, and the histogram bars are getting longer, showing strong bullish momentum. The 5, 8, and 13 moving averages are arranged bullishly and dispersing upward. KDJ’s K is in the 73 strong zone, with D at 67—bulls are in control, and volume has increased too. You can enter.
════════════════════
🔴 $UNI 30 minutes — Bullish signal
⚠️ Technicals: Confirm the bullish bias on the 4-hour chart! On the 30-minute MACD, a bullish golden cross above zero with increased volume—the red bars are getting longer, and the bulls are gaining strength. The moving averages (5 crossing 8 and 13) have just formed a bullish arrangement dispersing upward. KDJ golden cross with K at 79, still not yet in the overbought zone, so the short-term setup can still follow through. Volume is also at about 1.4x, and with multi-period resonance together, the upside signal is relatively steady.
════════════════════
🔴 $HEMI 30 minutes — Bullish signal
⚠️ Technicals: 4-hour bigger trend is slightly bullish and confirms with resonance. On the 30-minute MACD, a golden cross above zero with increased volume—red histogram bars lengthen. The moving averages are bullish and dispersing. KDJ golden cross with K at 63 is not overbought; volume has expanded to nearly double, so you can go long along the trend.
════════════════════
🔔 Watch for the first-hand market moves and anomalies 🔔
#多周期共振 #XMR #UNI #HEMI
📌 When trading, pay attention to whether the candlestick patterns match