
On February 4th, BTC has fallen from the high of $97,000 on January 15th to $73,000; the speed is fast, and the magnitude is deep, instantly extinguishing the optimistic sentiment that originally thought there would be resistance at 80k. To say there is no panic would be a lie. Therefore, it is necessary to review what changes have occurred in BTC's chip structure during this period and what important information is hidden behind it.
For ease of understanding, I have compiled the complete URPD data into a table, using each $10,000 interval as a section, allowing for a clear observation of the trajectory of chip movement to assess current market sentiment and behavior.
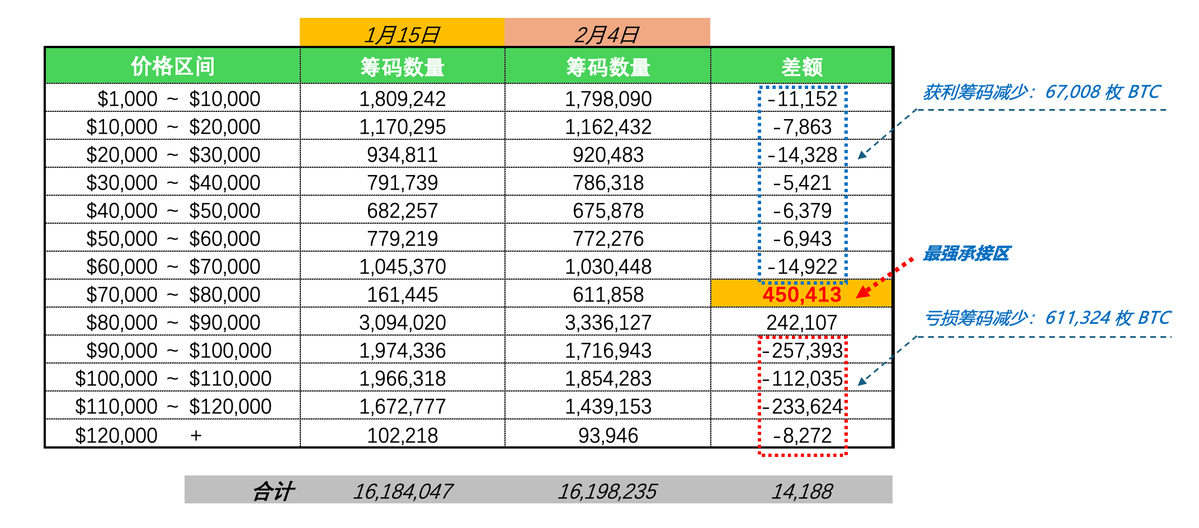
As shown in Figure 1, during the period from 1/15 to 2/4, the total profit chips decreased by 67,008 BTC, accounting for 9.7% of the total decrease; while the loss chips above decreased by 611,324 BTC, accounting for 88% of the total decrease;
This indicates that in the current overall downward trend, long-term holders still have floating profits and the chips they intend to sell are becoming fewer. If it weren't for the belief that it is completely unnecessary to sell here due to profit taking, or simply ignoring price fluctuations for long-term holding across cycles; in short, the more it falls, the less is sold.
The big players are stuck with chips above, and they are the dominant force of selling pressure currently. In just 20 days, there has been a net decrease of over 600,000 chips, which shows how strong the willingness to flee without considering costs is under panic.
Conversely, we see that there has been a large amount of support in the two ranges of $80,000~$90,000 and $70,000~$80,000. Especially in the latter, there was a net purchase of 450,413 BTC, which is almost double that of the previous range.
It can be seen that there is hidden capital behind the market, showing its stance with strong strength and real money — you dare to fall, I dare to buy! And the more it falls, the more it buys. I believe this is also a significant difference between this cycle and any previous cycles.
Even under the premise that the four-year cycle theory has not been falsified, bulls will still resist layer by layer during the decline. 100k, 90k, 80k, 70k... the accumulation area is gradually moving down, rather than dropping in a step-like manner.
Now many people are predicting that this bear bottom will be at 50k or 30k, to which I hold a reserved opinion, but I believe that once the bears compress the bulls' 'territory' to the extreme, with insufficient supply and subsequent weakness, a strong counterattack from the bulls will definitely come!
--------------------------------------------
Finally, I want to leave a question for everyone to think about:
In the statistical chart, the total number of chips on 2026/1/15 is 16,184,047; while on February 4 it is 16,198,235; where does the additional 14,188 come from? What does this mean? Feel free to leave comments in the comment section to discuss together!
---------------------------------------------
The above is for learning and communication purposes only and should not be considered as investment advice!
