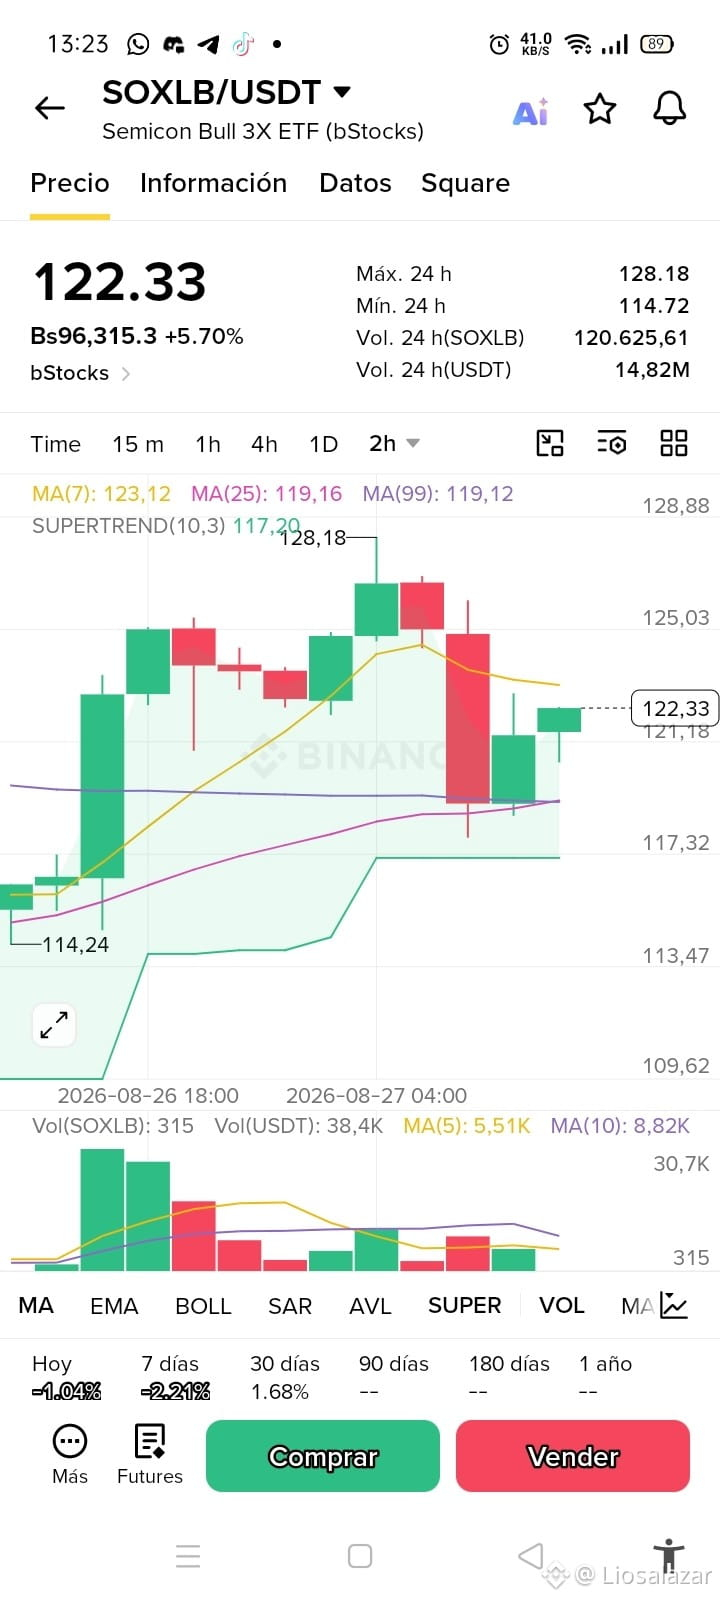
Technical analysis: SOXLB/USDT (Semicon Bull 3X ETF bStocks) on the 2-hour timeframe
Analysis of the SOXLB/USDT pair, which shows a strong bullish impulse of +5.70%, reacting positively after bouncing off the confluence of its 25- and 99-period moving averages.
Key market data:
Current price: 122.33 USDT (+5.70%).
24h high: 128.18 USDT.
24h low: 114.72 USDT.
24h volume (USDT): 14.82M USDT.
Technical levels and key indicators (2h):
Moving Averages:
MA(7): 123.12 USDT (dynamic and immediate short-term resistance).
MA(25): 119.16 USDT (key medium-term technical support).
MA(99): 119.12 USDT (long-term structural support).
SuperTrend (10,3): Remains bullish (green), with its defensive base set at 117.20 USDT.
Reference points:
Local resistance: Recent ceiling at 128.18 USDT.
Key defensive support: Floor of the impulse at 114.24 USDT.
Outlook:
SOXLB shows a notable buyer bounce on the 2-hour chart. After suffering a sharp pullback from 128.18 USDT, price found a strong demand zone at the defensive crossover formed by MA(25) ($119.16) and MA(99) ($119.12), avoiding a larger correction.
Currently, the quotation is trying to regain ground toward the MA(7) at 123.12 USDT. To confirm the restart of the uptrend and seek a retest of the 128.18 USDT high, the asset needs to break above the 123.12 USDT resistance with volume. If momentum is lost, the key support zone and operating floor will remain firm within the defensive cluster of 119.12 - 119.16 USDT.
(Disclaimer: Informational content structured for Binance Square. It does not constitute financial or investment advice. Always do your own research).
#SOXLB #Semiconductors #bStocks #Crypto #BinanceSquare #TechnicalAnalysis
Analysis of the SOXLB/USDT pair, which shows a strong bullish impulse of +5.70%, reacting positively after bouncing off the confluence of its 25- and 99-period moving averages.
Key market data:
Current price: 122.33 USDT (+5.70%).
24h high: 128.18 USDT.
24h low: 114.72 USDT.
24h volume (USDT): 14.82M USDT.
Technical levels and key indicators (2h):
Moving Averages:
MA(7): 123.12 USDT (dynamic and immediate short-term resistance).
MA(25): 119.16 USDT (key medium-term technical support).
MA(99): 119.12 USDT (long-term structural support).
SuperTrend (10,3): Remains bullish (green), with its defensive base set at 117.20 USDT.
Reference points:
Local resistance: Recent ceiling at 128.18 USDT.
Key defensive support: Floor of the impulse at 114.24 USDT.
Outlook:
SOXLB shows a notable buyer bounce on the 2-hour chart. After suffering a sharp pullback from 128.18 USDT, price found a strong demand zone at the defensive crossover formed by MA(25) ($119.16) and MA(99) ($119.12), avoiding a larger correction.
Currently, the quotation is trying to regain ground toward the MA(7) at 123.12 USDT. To confirm the restart of the uptrend and seek a retest of the 128.18 USDT high, the asset needs to break above the 123.12 USDT resistance with volume. If momentum is lost, the key support zone and operating floor will remain firm within the defensive cluster of 119.12 - 119.16 USDT.
(Disclaimer: Informational content structured for Binance Square. It does not constitute financial or investment advice. Always do your own research).
#SOXLB #Semiconductors #bStocks #Crypto #BinanceSquare #TechnicalAnalysis