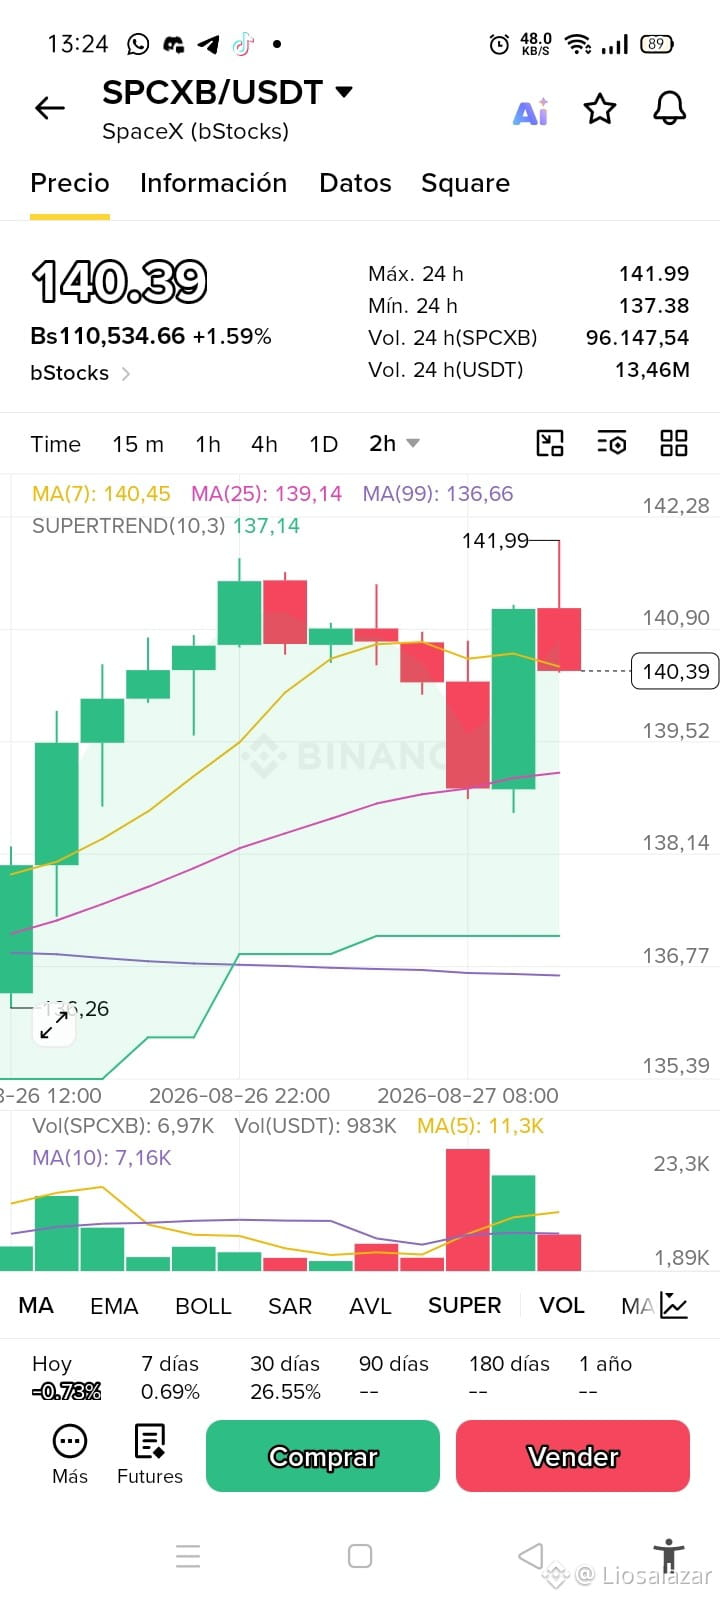
Technical Analysis: SPCXB/USDT (SpaceX bStocks Spot) on the 2-Hour timeframe
Analysis of the SPCXB/USDT pair, which shows an increase of +1.59%, indicating volatility after rebounding strongly from the 25-period moving average and attempting to break the 141.99 USDT resistance.
Key market data:
Current price: 140.39 USDT (+1.59%).
24h high: 141.99 USDT.
24h low: 137.38 USDT.
24h volume (USDT): 13.46M USDT.
Key technical levels and indicators (2h):
Moving Averages:
MA(7): 140.45 USDT (dynamic immediate short-term resistance).
MA(25): 139.14 USDT (medium-term technical support).
MA(99): 136.66 USDT (long-term structural support).
SuperTrend (10,3): Remains bullish (green), placing its defensive base at 137.14 USDT.
Reference points:
Local resistance: Recent ceiling at 141.99 USDT.
Key defensive support: Floor of the prior pullback at 137.38 USDT.
Outlook:
SPCXB (SpaceX bStocks) maintains a dominant bullish structure on the 2-hour chart. After suffering a brief correction that sought the MA(25) zone, a strong bullish candle reacted from 138.00 USDT to project the price up to the 141.99 USDT high.
Currently, the price is pausing slightly, trading just below the MA(7) at 140.45 USDT. To keep the bullish move going and target new highs above 141.99 USDT, buyers must secure closes above 140.50 USDT. If profit-taking pressures the market, the first key defensive zone is at the MA(25) ($139.14), supported by the bullish SuperTrend (137.14 USDT).
(Disclaimer: Informational structured content for Binance Square. It does not constitute financial or investment advice. Always do your own research).
#SPCXB #SpaceX #bStocks #Crypto #BinanceSquare #TechnicalAnalysis
Analysis of the SPCXB/USDT pair, which shows an increase of +1.59%, indicating volatility after rebounding strongly from the 25-period moving average and attempting to break the 141.99 USDT resistance.
Key market data:
Current price: 140.39 USDT (+1.59%).
24h high: 141.99 USDT.
24h low: 137.38 USDT.
24h volume (USDT): 13.46M USDT.
Key technical levels and indicators (2h):
Moving Averages:
MA(7): 140.45 USDT (dynamic immediate short-term resistance).
MA(25): 139.14 USDT (medium-term technical support).
MA(99): 136.66 USDT (long-term structural support).
SuperTrend (10,3): Remains bullish (green), placing its defensive base at 137.14 USDT.
Reference points:
Local resistance: Recent ceiling at 141.99 USDT.
Key defensive support: Floor of the prior pullback at 137.38 USDT.
Outlook:
SPCXB (SpaceX bStocks) maintains a dominant bullish structure on the 2-hour chart. After suffering a brief correction that sought the MA(25) zone, a strong bullish candle reacted from 138.00 USDT to project the price up to the 141.99 USDT high.
Currently, the price is pausing slightly, trading just below the MA(7) at 140.45 USDT. To keep the bullish move going and target new highs above 141.99 USDT, buyers must secure closes above 140.50 USDT. If profit-taking pressures the market, the first key defensive zone is at the MA(25) ($139.14), supported by the bullish SuperTrend (137.14 USDT).
(Disclaimer: Informational structured content for Binance Square. It does not constitute financial or investment advice. Always do your own research).
#SPCXB #SpaceX #bStocks #Crypto #BinanceSquare #TechnicalAnalysis