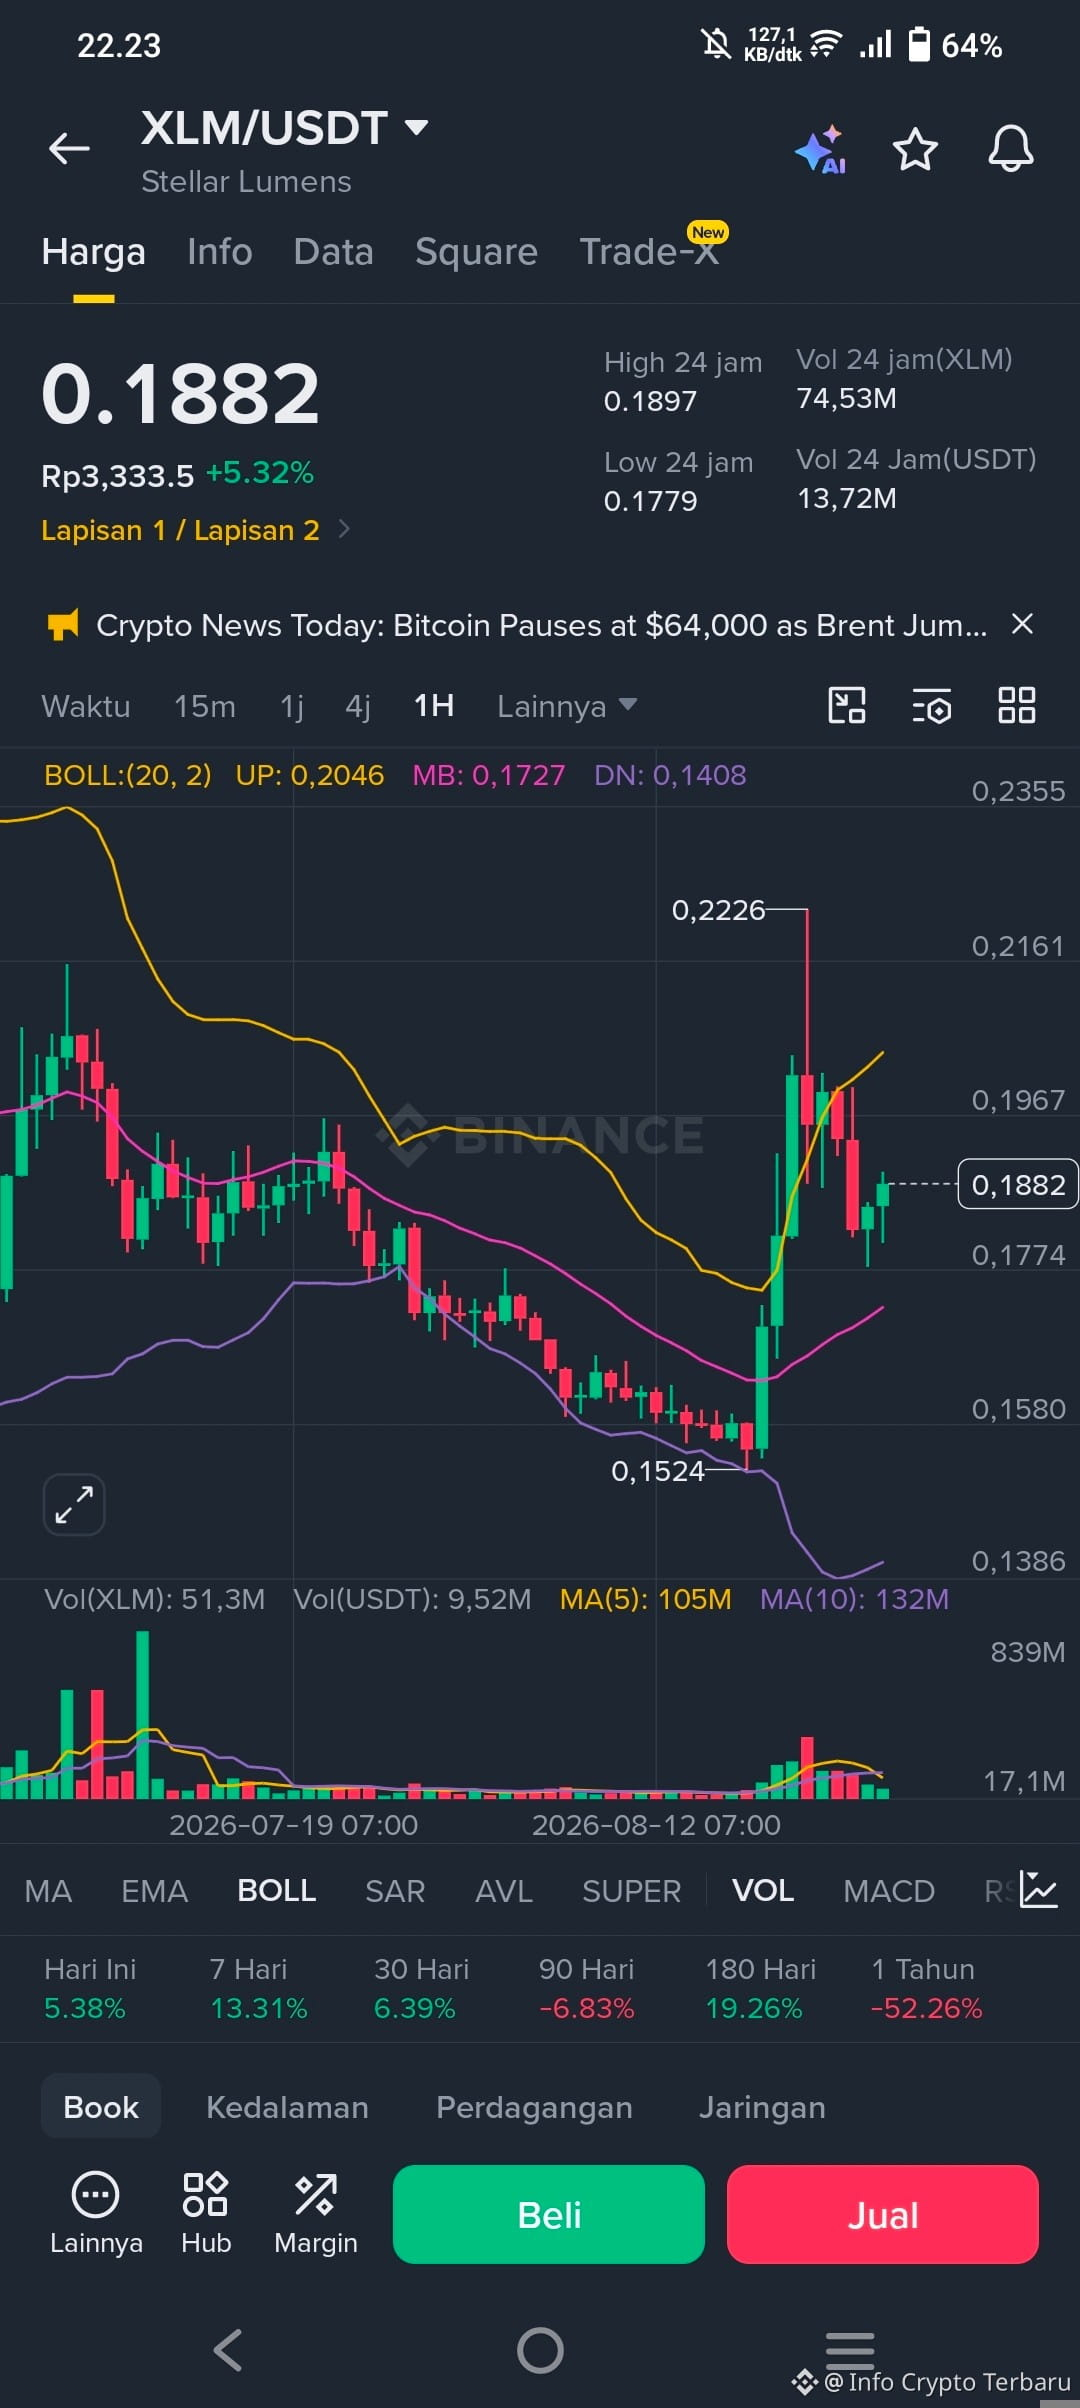
$XLM is being traded above $0.18, holding a neutral-bullish short-term tone because it remains above the 50-day and 100-day EMA, but is still capped below the 200-day EMA at $0.19.
This currency pair recently rebounded from the mid-$0.15 range, with the RSI hovering around 56, while the MACD remains above zero with a positive histogram, even though it is starting to moderate. Overall, these technical indicators point to improving momentum but have not yet turned into a fully solid bullish trend.
🔥The nearest resistance is the 200-day EMA around $0.19, with a horizontal line at $0.22 reinforcing a broader supply zone above the current price and limiting further upside expansion unless it is broken decisively.
⛔On the downside, initial support is seen at the 100-day EMA near $0.18, which aligns with the 50-day EMA. As long as XLM holds above this EMA cluster, pullbacks are more likely to attract buyers, keeping the bias slightly constructive while the market consolidates below the $0.19 area.
#OktaCrowdStrikeSurgeOnEarningsBeat #BestBuyQ2RevenueTopsEstimatesLiftsOutlook $ERN $OM
This currency pair recently rebounded from the mid-$0.15 range, with the RSI hovering around 56, while the MACD remains above zero with a positive histogram, even though it is starting to moderate. Overall, these technical indicators point to improving momentum but have not yet turned into a fully solid bullish trend.
🔥The nearest resistance is the 200-day EMA around $0.19, with a horizontal line at $0.22 reinforcing a broader supply zone above the current price and limiting further upside expansion unless it is broken decisively.
⛔On the downside, initial support is seen at the 100-day EMA near $0.18, which aligns with the 50-day EMA. As long as XLM holds above this EMA cluster, pullbacks are more likely to attract buyers, keeping the bias slightly constructive while the market consolidates below the $0.19 area.
#OktaCrowdStrikeSurgeOnEarningsBeat #BestBuyQ2RevenueTopsEstimatesLiftsOutlook $ERN $OM