Cross Technical Analysis (2h vs. 4h)
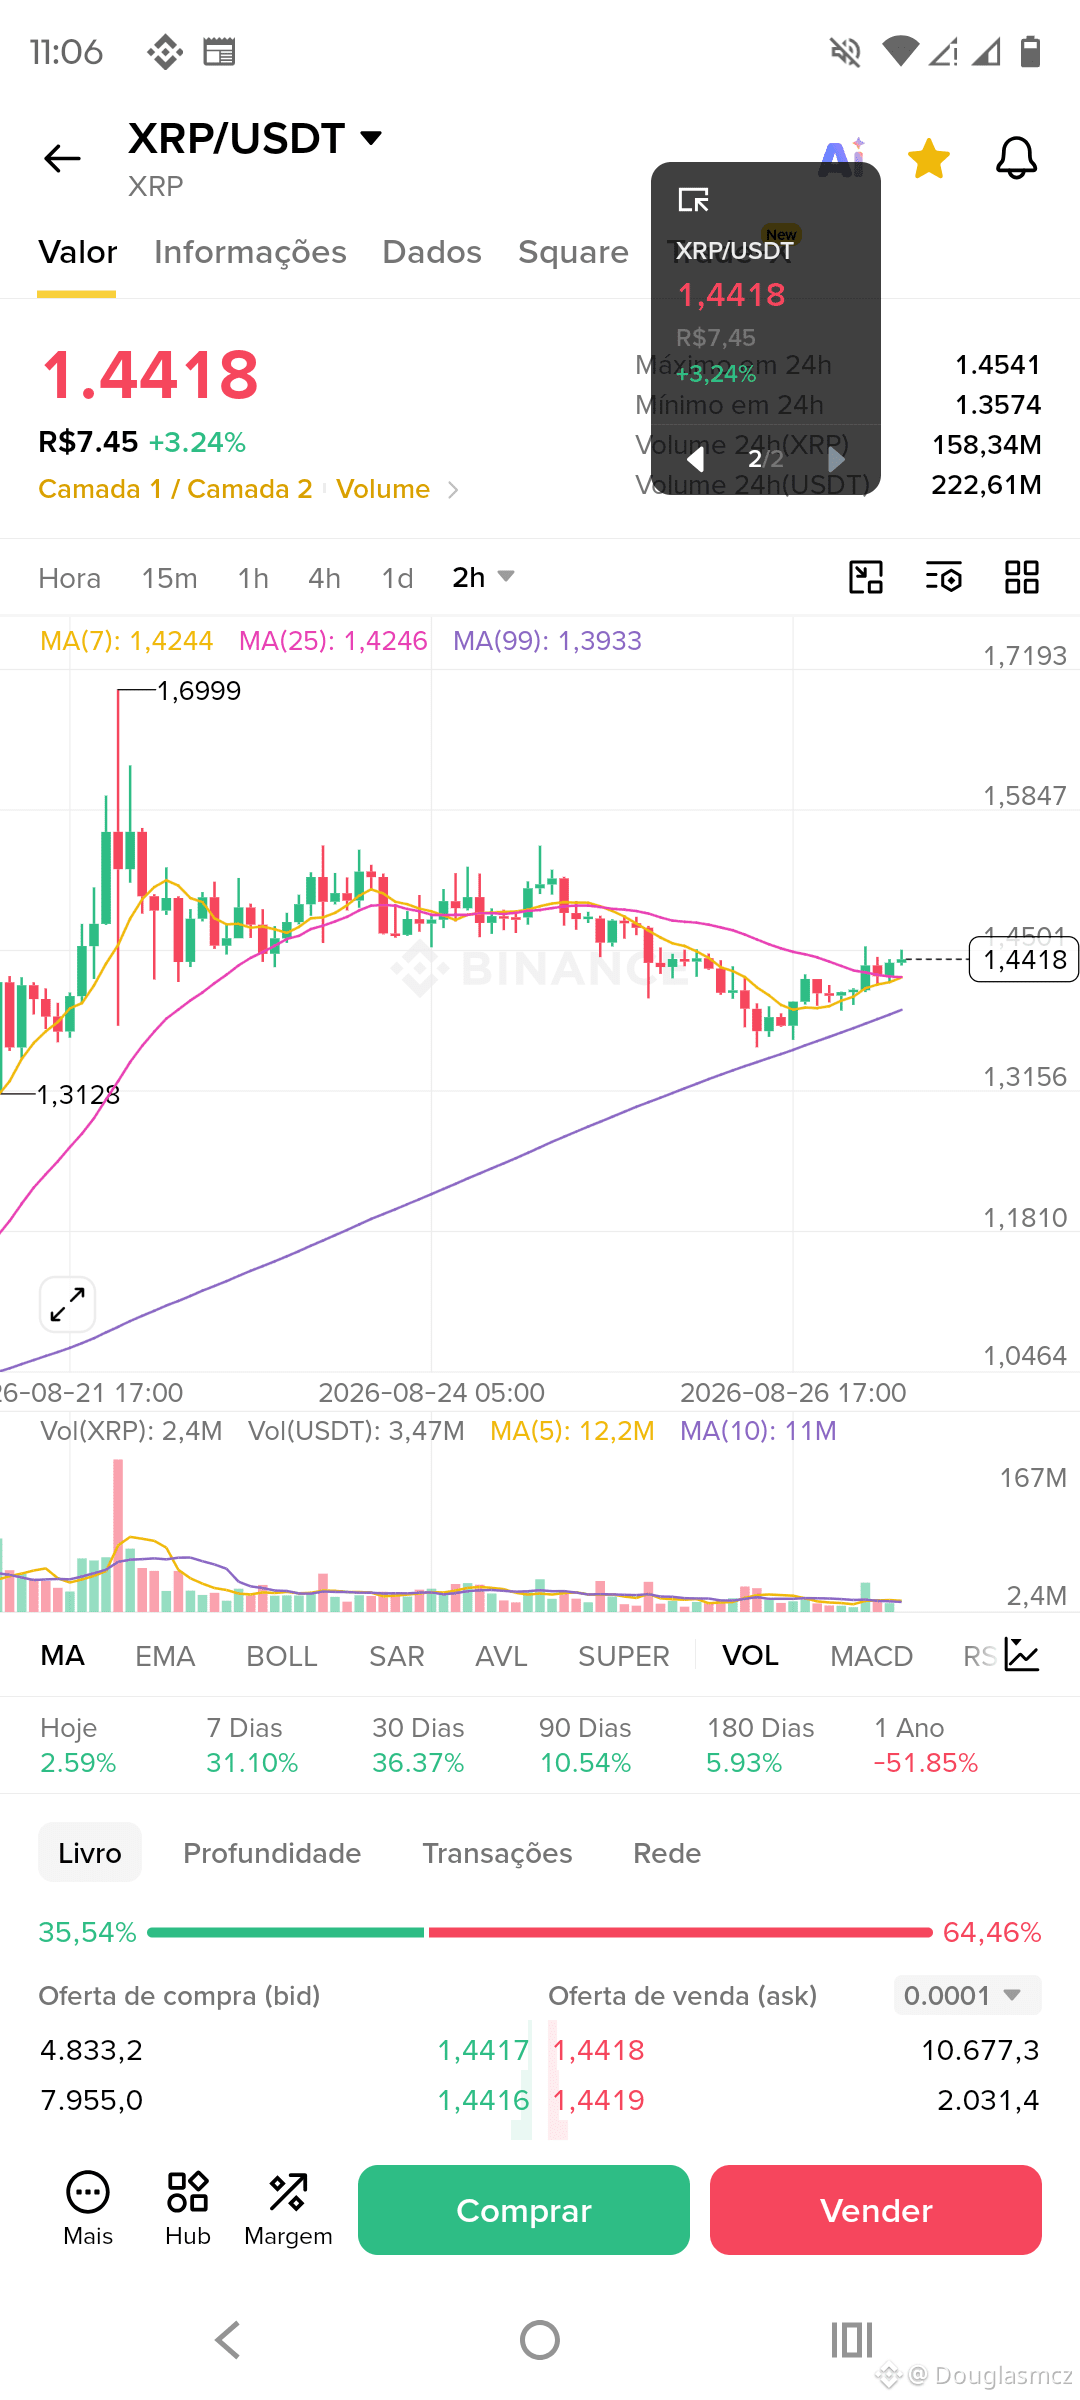
False Breakout (2h): In the first chart, price tried to break upward out of the consolidation above the short averages (MA7 and MA25), but there was not enough expressive buying volume to sustain the move. This behavior is classic of a trap (bull trap), where price rises without strength and quickly reverses right after.
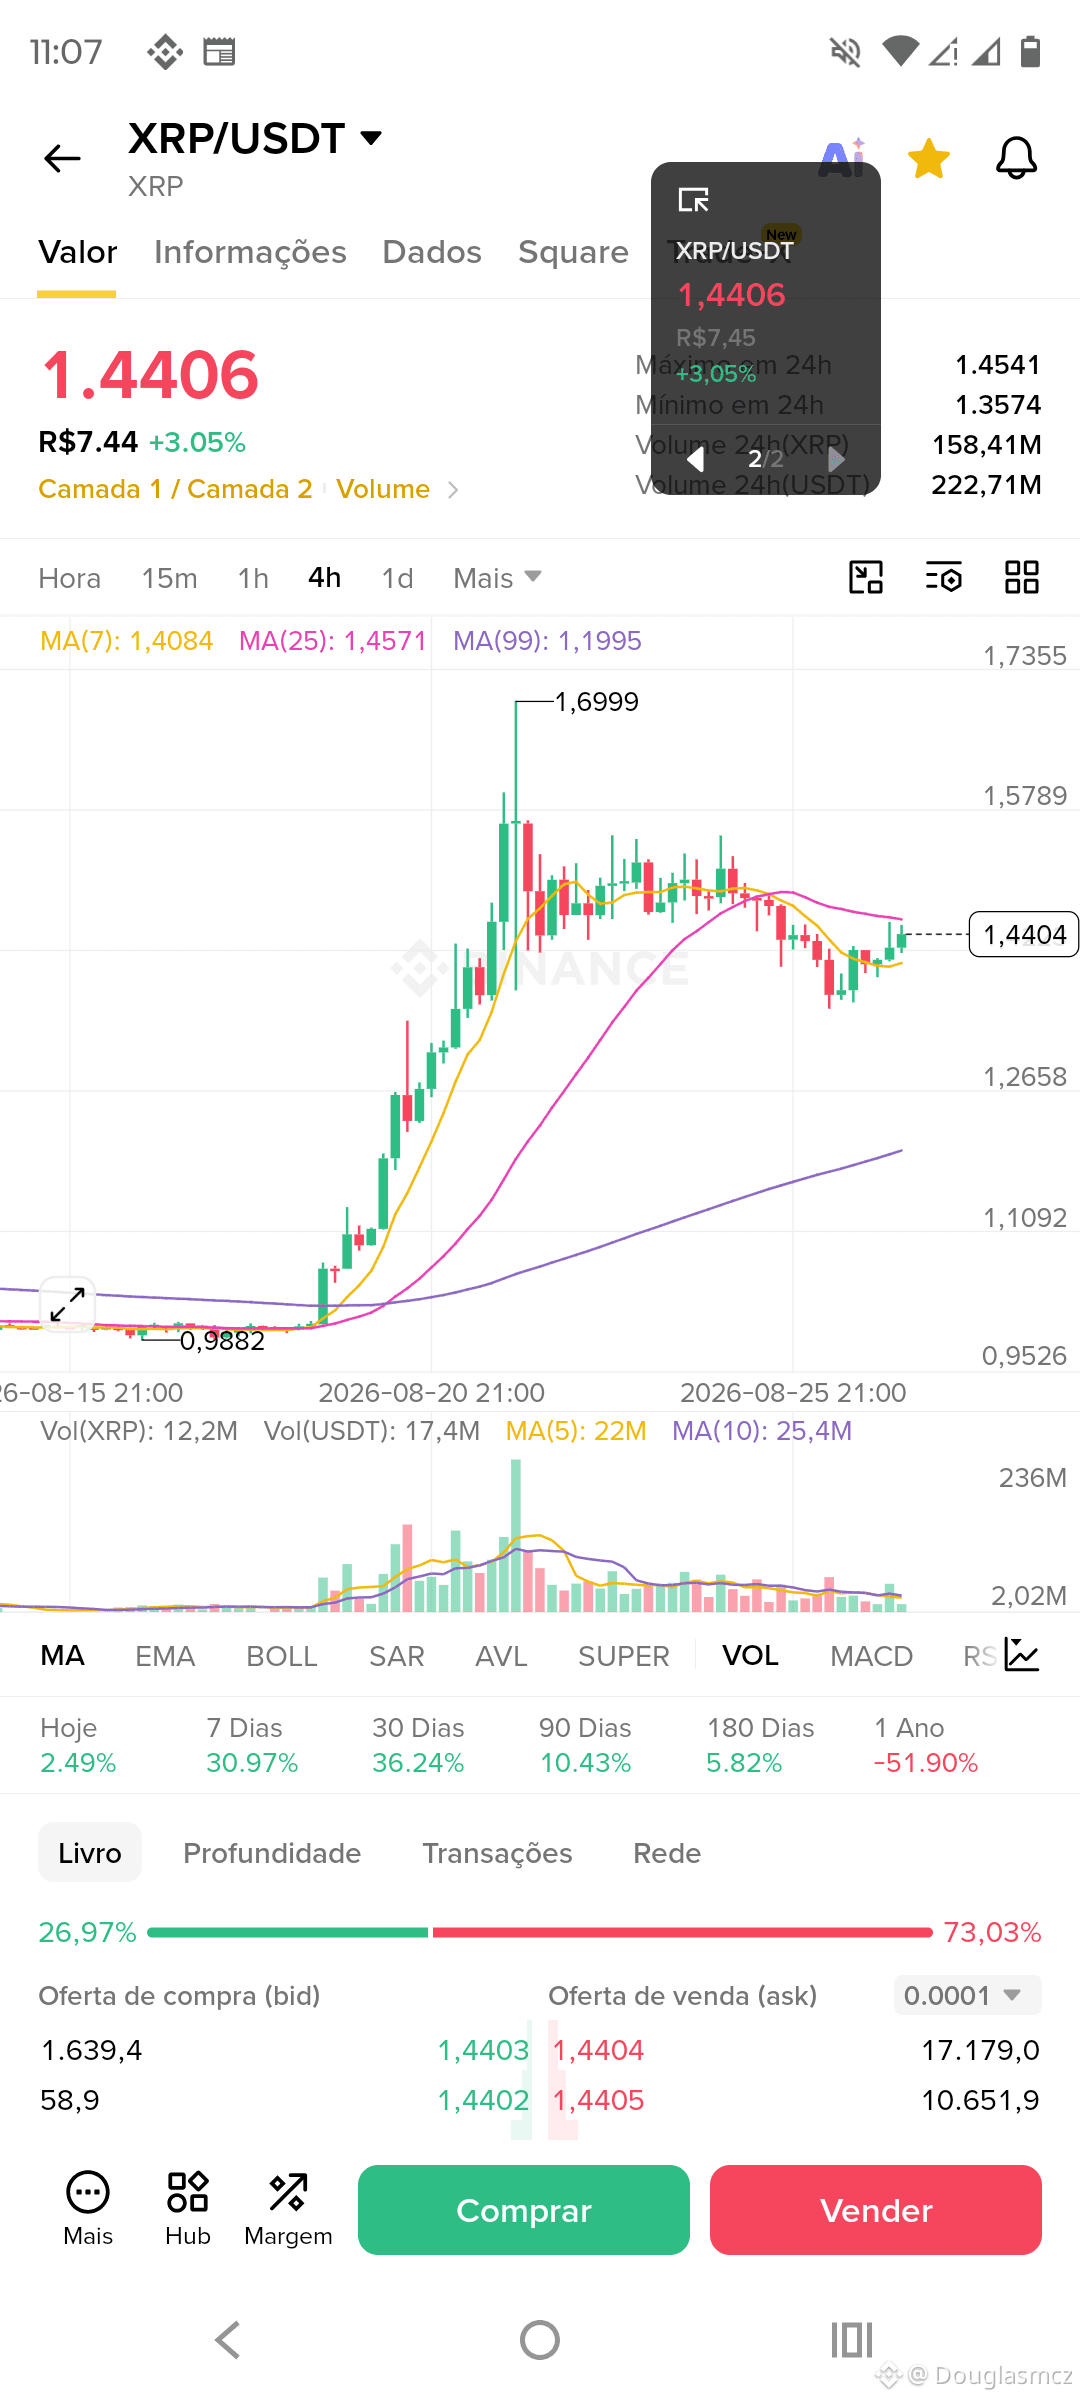
Searching for the Macro Support (4h): Looking at the second chart makes it clear why the correction intensified. Price built up below the MA25 (pink line at 1.4571) and created room to seek liquidity further down. The MA99 (purple line at 1.1995) works exactly like this long-term magnet and a highly relevant support.
⚠️ Important Risks to Consider
Risk of Severe Depreciation: Highly volatile assets like XRP carry the risk of fast and substantial losses. If the MA99 support on the 4h chart (region around 1.19 USDT) fails, the technical outlook could sour and open room for even deeper corrections toward the prior low of 0.9882 USDT.
Diversification Context: Trading correction timeframes requires strict discipline. Avoid concentrating an excessive portion of your capital in this single trade, protecting yourself against unexpected fluctuations in the broader crypto market.
🔎 What to Monitor Now
Candle Pattern at MA99 (4h): Check whether price will leave long lower wicks (downward rejection) as it approaches this 1.20 USDT area.
Confirmation Volume: A touch of the MA99 accompanied by a spike in buying volume will increase the statistical relevance of a technical rebound.
False Breakout (2h): In the first chart, price tried to break upward out of the consolidation above the short averages (MA7 and MA25), but there was not enough expressive buying volume to sustain the move. This behavior is classic of a trap (bull trap), where price rises without strength and quickly reverses right after.
Searching for the Macro Support (4h): Looking at the second chart makes it clear why the correction intensified. Price built up below the MA25 (pink line at 1.4571) and created room to seek liquidity further down. The MA99 (purple line at 1.1995) works exactly like this long-term magnet and a highly relevant support.
⚠️ Important Risks to Consider
Risk of Severe Depreciation: Highly volatile assets like XRP carry the risk of fast and substantial losses. If the MA99 support on the 4h chart (region around 1.19 USDT) fails, the technical outlook could sour and open room for even deeper corrections toward the prior low of 0.9882 USDT.
Diversification Context: Trading correction timeframes requires strict discipline. Avoid concentrating an excessive portion of your capital in this single trade, protecting yourself against unexpected fluctuations in the broader crypto market.
🔎 What to Monitor Now
Candle Pattern at MA99 (4h): Check whether price will leave long lower wicks (downward rejection) as it approaches this 1.20 USDT area.
Confirmation Volume: A touch of the MA99 accompanied by a spike in buying volume will increase the statistical relevance of a technical rebound.