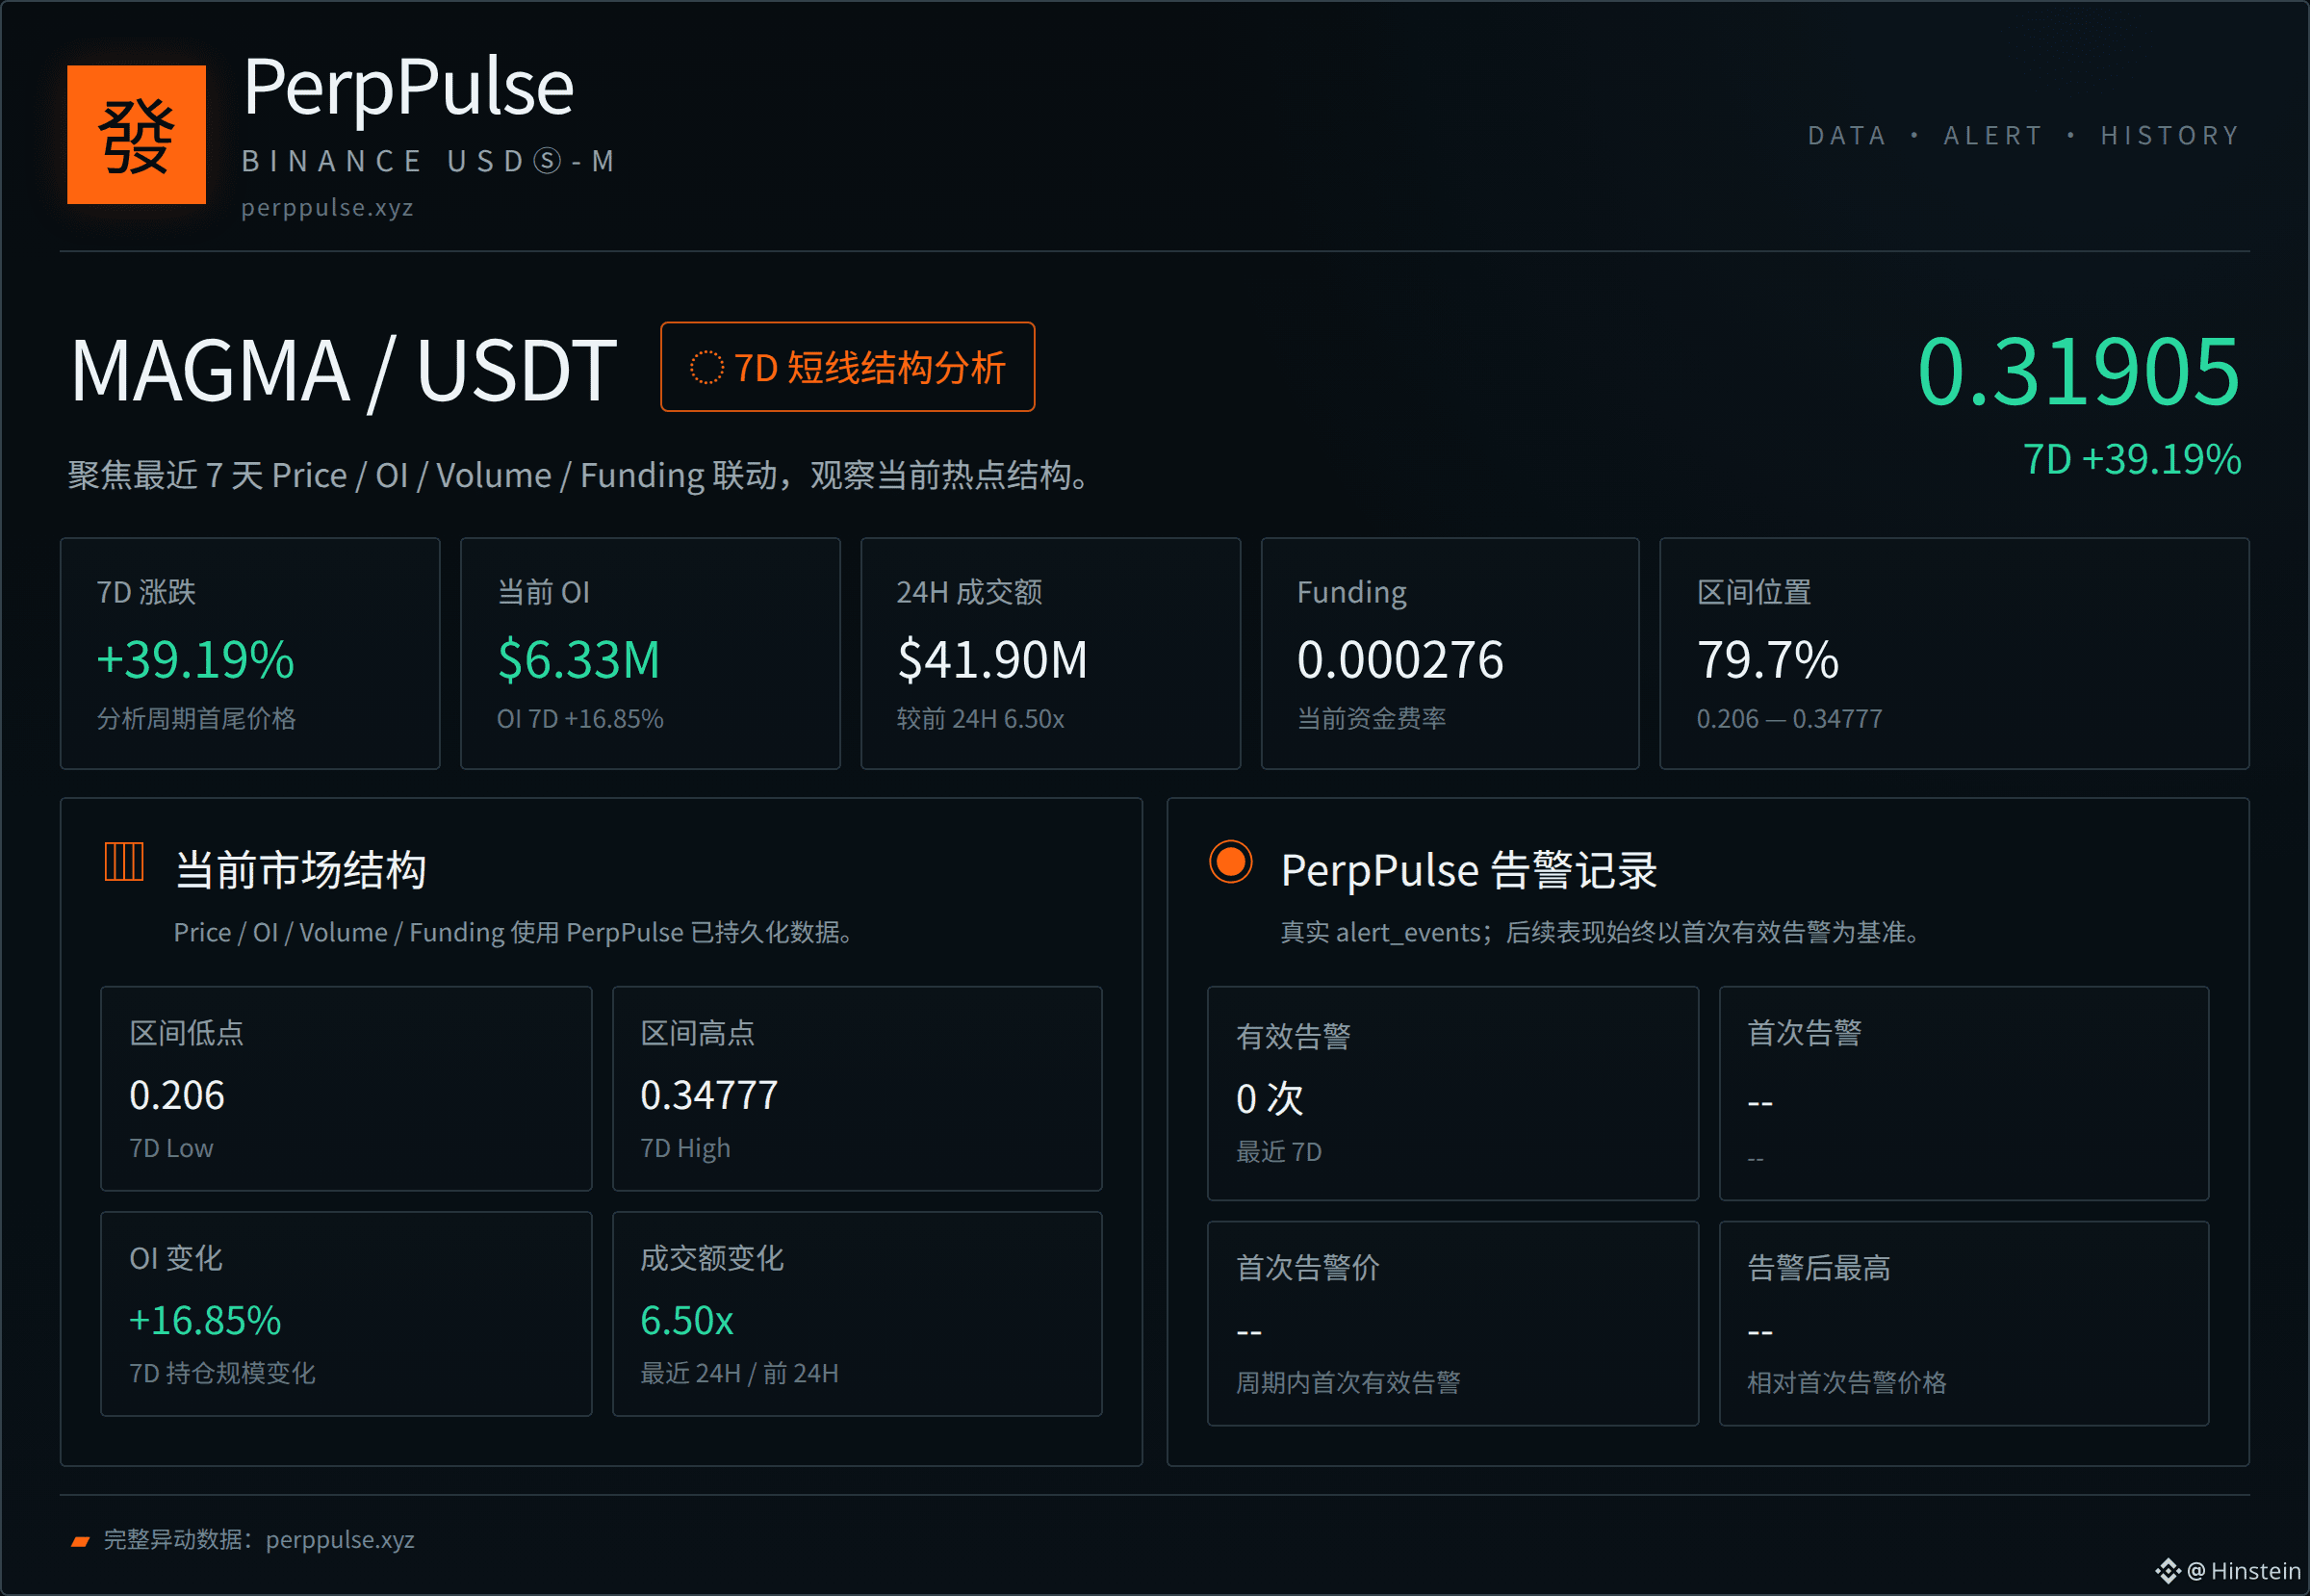
The trend for $MAGMA this week is very typical: first a rapid surge, then a period of tight consolidation on declining volume, and over the past two days a renewed volume-backed breakout. Over 7 days, the price moved from 0.22922 to 0.31905, a gain of 39.19%. The range high is 0.34777 and the low is 0.206. It’s currently at 79.7% of the 7-day range position—within the high zone.
The first half of the week’s rhythm is very clear. From August 21 to 22, the price surged from around 0.23 up to the phase high of 0.34777. Daily traded notional briefly expanded to 33.77M—this was the first leg of the main rally. Then it entered a pullback: price repeatedly churned between 0.21 and 0.24, and trading volume shrank to below 1M, which is typical of digestion after a surge.
The turning point came at 2 a.m. on August 26. The price restarted from around 0.22, and several consecutive candlesticks rose on increased volume. By August 27, it regained the 0.31905 level. In the last 24 hours, traded notional was 41.90M, compared with 6.45M in the prior 24 hours—an increase of 6.5 times. Volume has been reactivated.
The funding side is also coordinating in sync. Open interest rose from a recent low of 3.57M to the current 6.33M. Over the past 7 days, the overall increase is 16.85%, suggesting this rally is not just short-covering, but also involves new positions entering. The current funding rate is 0.0276%, higher than the 7-day average of 0.0127%. Long positions’ cost is being lifted, though it hasn’t reached an extremely crowded level yet.
With the current price at 0.31905, there is still some distance to the range high of 0.34777. The observation points are very clear next: on the upside, watch whether 0.34777 can break out with volume and hold; on the downside, watch whether OI declines in tandem during pullbacks. If OI continues to increase while the price stalls, the risk of long crowding should be taken seriously. If the funding rate spikes quickly, short-term overheating signals will strengthen. At the moment, price, OI, traded volume, and funding rate are all strengthening simultaneously across four dimensions—this is a long-side resonance structure.
Complete anomaly dataset: perppulse.xyz
The first half of the week’s rhythm is very clear. From August 21 to 22, the price surged from around 0.23 up to the phase high of 0.34777. Daily traded notional briefly expanded to 33.77M—this was the first leg of the main rally. Then it entered a pullback: price repeatedly churned between 0.21 and 0.24, and trading volume shrank to below 1M, which is typical of digestion after a surge.
The turning point came at 2 a.m. on August 26. The price restarted from around 0.22, and several consecutive candlesticks rose on increased volume. By August 27, it regained the 0.31905 level. In the last 24 hours, traded notional was 41.90M, compared with 6.45M in the prior 24 hours—an increase of 6.5 times. Volume has been reactivated.
The funding side is also coordinating in sync. Open interest rose from a recent low of 3.57M to the current 6.33M. Over the past 7 days, the overall increase is 16.85%, suggesting this rally is not just short-covering, but also involves new positions entering. The current funding rate is 0.0276%, higher than the 7-day average of 0.0127%. Long positions’ cost is being lifted, though it hasn’t reached an extremely crowded level yet.
With the current price at 0.31905, there is still some distance to the range high of 0.34777. The observation points are very clear next: on the upside, watch whether 0.34777 can break out with volume and hold; on the downside, watch whether OI declines in tandem during pullbacks. If OI continues to increase while the price stalls, the risk of long crowding should be taken seriously. If the funding rate spikes quickly, short-term overheating signals will strengthen. At the moment, price, OI, traded volume, and funding rate are all strengthening simultaneously across four dimensions—this is a long-side resonance structure.
Complete anomaly dataset: perppulse.xyz