$4,590 gold—would you dare buy it?
First, look at the surface: up 20%, retail investors chase higher out of FOMO.
By late June, it bottomed around 3,940, then surged all the way to 4,697. In August alone, it rose 13%, delivering the strongest single month performance of the year. On Wednesday, it just touched a 3-month high, then a single long bearish candle smashed the move down, falling 1.4%.
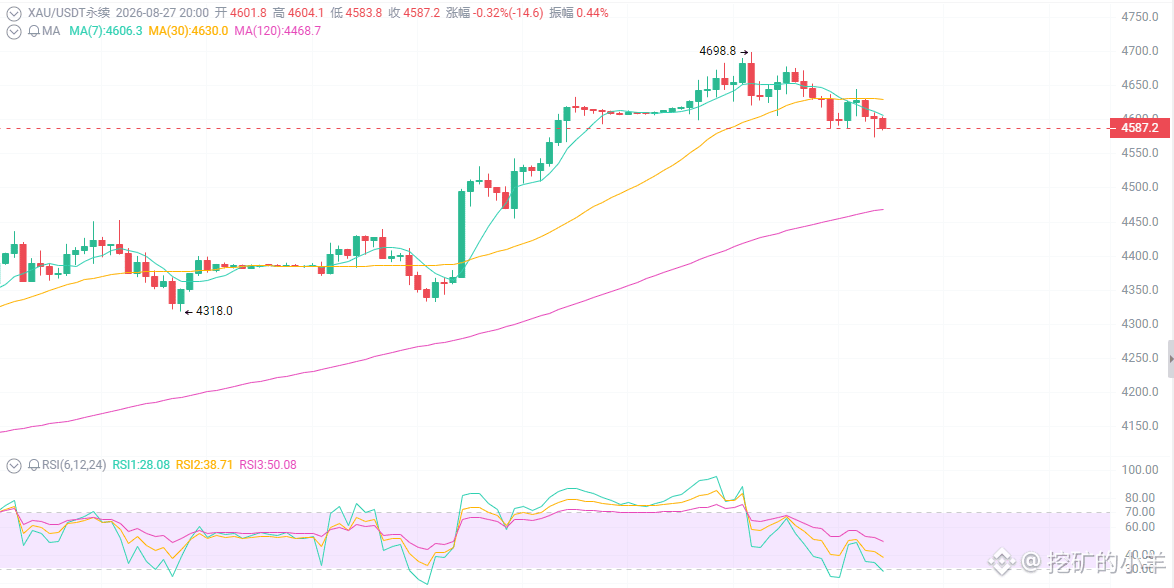
The candlestick chart tells you: the market is at peak overbought, the RSI has started to cool off from high levels, a bearish MACD divergence is faintly emerging, and the short-term market looks overheated.
First thing: the Ministry of Finance’s “dollar depreciation trade” has ignited gold, but the market may have gone too far.
What’s the key catalyst behind this August rebound? Not geopolitics, not inflation—it's the U.S. Treasury expanding its long-term bond repurchase program. The market interprets it as “fiscal-led + the dollar taking a more active depreciation stance,” and gold shoots higher.
Fed Chair Warsh is set to speak at Jackson Hole on Friday. Will he quietly allow the Treasury to do this?
But the market has already fully priced in the expectation that “Warsh will definitely be dovish.” What if he isn’t?
Second thing: PCE data still feels sticky, and rate cuts aren’t coming that fast.
July PCE came in at 3.7% year over year (vs. 3.6% expected), and core PCE at 3.3% year over year, matching expectations. Inflation hasn’t eased meaningfully, so markets are pricing a 36–40% probability of a rate hike in September, and the probability of a hike in December is still above 70%.
If inflation doesn’t fall, the Fed won’t easily loosen its stance.
The market was too optimistic before—now it’s starting to correct.
If Warsh turns more hawkish, gold could break straight through 4,500.
Retail traders are betting “rate cuts must come,” while the Fed is saying “inflation is still too high.”
Gold surged from 3,940 to 4,697, up 20%, pricing in both “rate-cut expectations” and “dollar depreciation” entirely.
Third thing: a technical signal has appeared that must be taken seriously.
That big bearish candle on Wednesday formed an early-stage Evening Star pattern—a top-reversal signal. A bearish MACD divergence is faintly visible; RSI has rolled over from overbought; and short-term momentum has clearly weakened.
4,520–4,560 is the defensive zone around the 200-day moving average—and it’s also the lower bound of this upward channel. Holding it means a textbook-style pullback confirmation; failing to hold it means a phase-level top.
Trading strategy
For aggressive short-term traders:
On rebounds, expect resistance at 4,635–4,655—consider a light short, stop-loss at 4,670, target 4,580–4,560. On a pullback, if 4,560–4,580 holds steady (confirmed by a 4-hour bullish candle), go long lightly, stop-loss at 4,540, target 4,640–4,680.
For medium-term traders:
If his remarks are dovish or unclear, hold above 4,700 and chase longs; targets 4,800–5,000. If his remarks are hawkish, and price breaks below 4,520, reduce exposure or even reverse—watch 4,450–4,300.
First, look at the surface: up 20%, retail investors chase higher out of FOMO.
By late June, it bottomed around 3,940, then surged all the way to 4,697. In August alone, it rose 13%, delivering the strongest single month performance of the year. On Wednesday, it just touched a 3-month high, then a single long bearish candle smashed the move down, falling 1.4%.
The candlestick chart tells you: the market is at peak overbought, the RSI has started to cool off from high levels, a bearish MACD divergence is faintly emerging, and the short-term market looks overheated.
First thing: the Ministry of Finance’s “dollar depreciation trade” has ignited gold, but the market may have gone too far.
What’s the key catalyst behind this August rebound? Not geopolitics, not inflation—it's the U.S. Treasury expanding its long-term bond repurchase program. The market interprets it as “fiscal-led + the dollar taking a more active depreciation stance,” and gold shoots higher.
Fed Chair Warsh is set to speak at Jackson Hole on Friday. Will he quietly allow the Treasury to do this?
But the market has already fully priced in the expectation that “Warsh will definitely be dovish.” What if he isn’t?
Second thing: PCE data still feels sticky, and rate cuts aren’t coming that fast.
July PCE came in at 3.7% year over year (vs. 3.6% expected), and core PCE at 3.3% year over year, matching expectations. Inflation hasn’t eased meaningfully, so markets are pricing a 36–40% probability of a rate hike in September, and the probability of a hike in December is still above 70%.
If inflation doesn’t fall, the Fed won’t easily loosen its stance.
The market was too optimistic before—now it’s starting to correct.
If Warsh turns more hawkish, gold could break straight through 4,500.
Retail traders are betting “rate cuts must come,” while the Fed is saying “inflation is still too high.”
Gold surged from 3,940 to 4,697, up 20%, pricing in both “rate-cut expectations” and “dollar depreciation” entirely.
Third thing: a technical signal has appeared that must be taken seriously.
That big bearish candle on Wednesday formed an early-stage Evening Star pattern—a top-reversal signal. A bearish MACD divergence is faintly visible; RSI has rolled over from overbought; and short-term momentum has clearly weakened.
4,520–4,560 is the defensive zone around the 200-day moving average—and it’s also the lower bound of this upward channel. Holding it means a textbook-style pullback confirmation; failing to hold it means a phase-level top.
Trading strategy
For aggressive short-term traders:
On rebounds, expect resistance at 4,635–4,655—consider a light short, stop-loss at 4,670, target 4,580–4,560. On a pullback, if 4,560–4,580 holds steady (confirmed by a 4-hour bullish candle), go long lightly, stop-loss at 4,540, target 4,640–4,680.
For medium-term traders:
If his remarks are dovish or unclear, hold above 4,700 and chase longs; targets 4,800–5,000. If his remarks are hawkish, and price breaks below 4,520, reduce exposure or even reverse—watch 4,450–4,300.