WHAT DO LIQUIDATION MAPS AND OPEN BTC ORDERS SHOW TODAY?
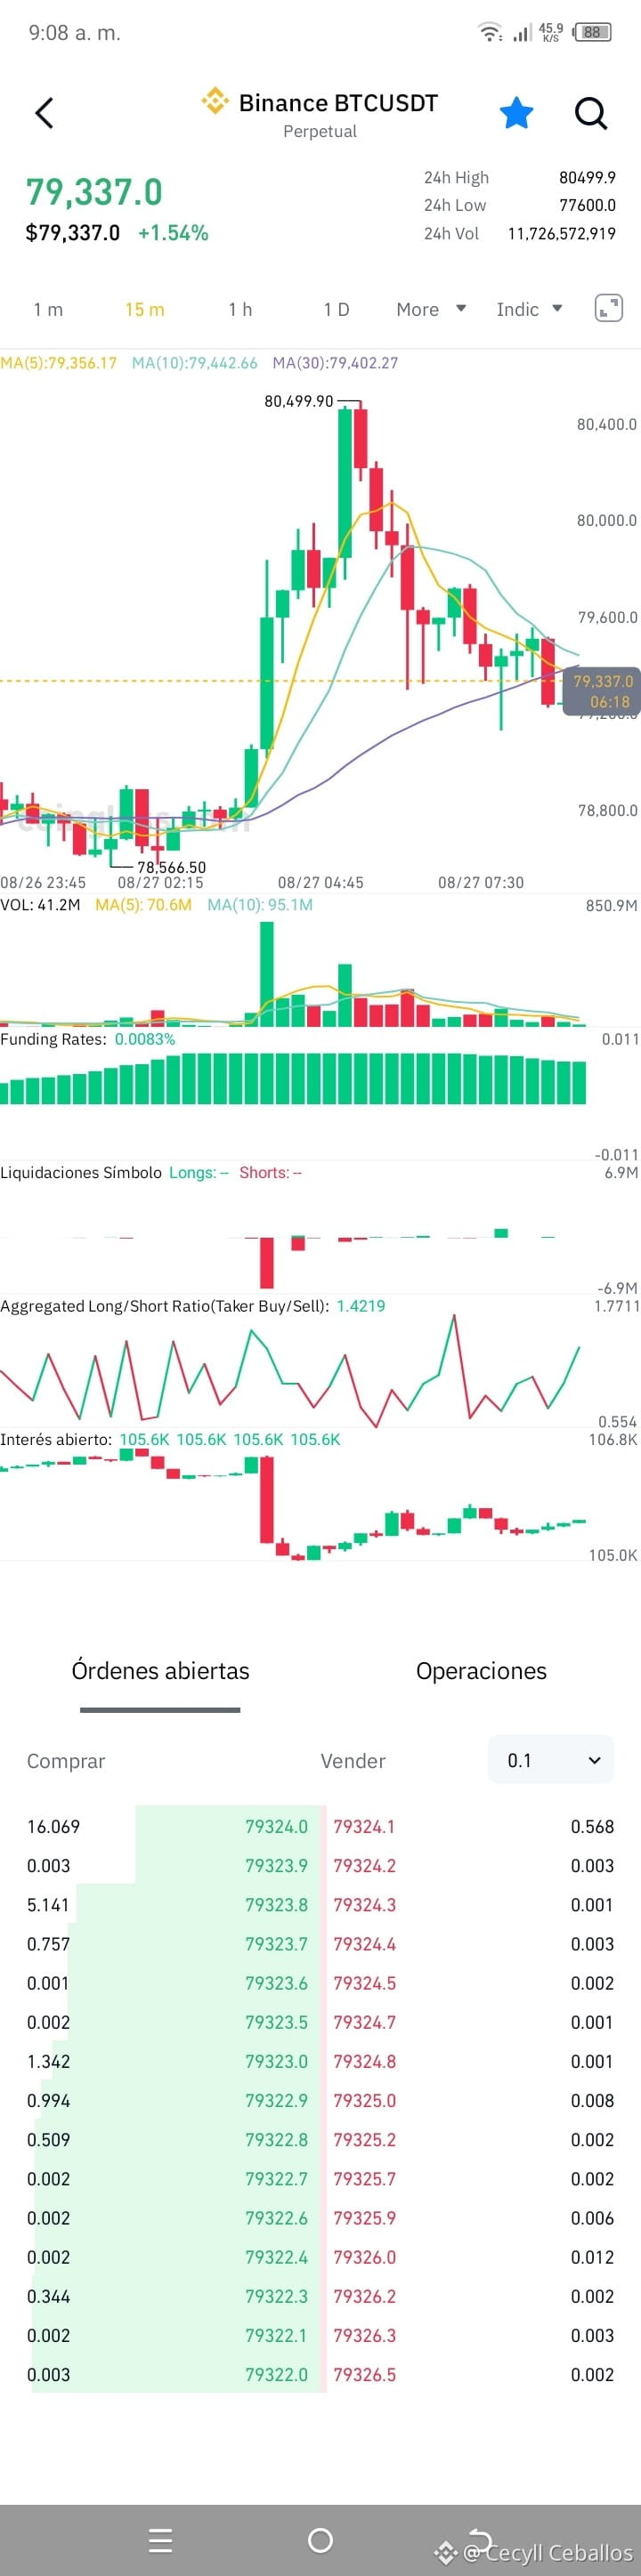
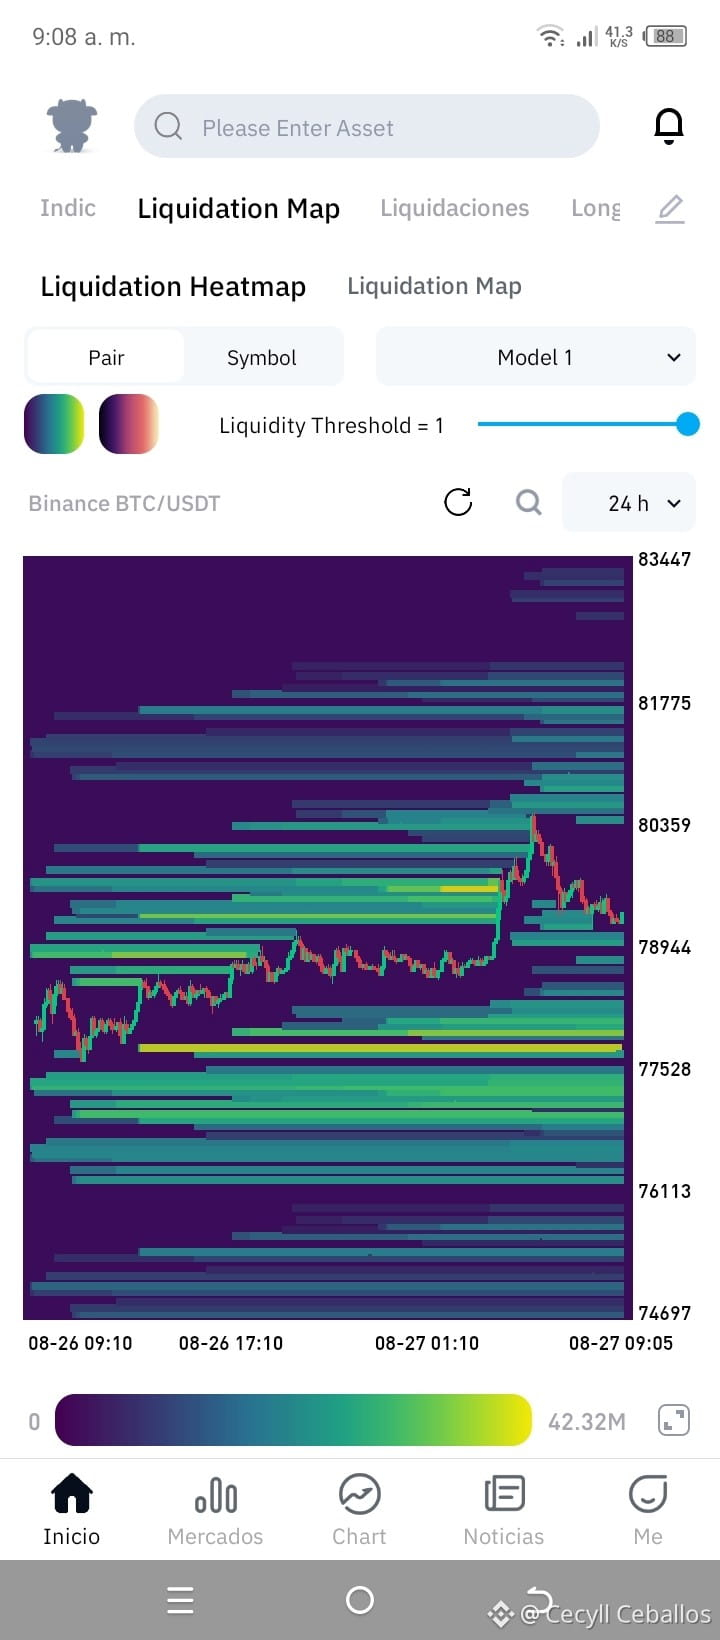
The Bitcoin market ($BTC ) has entered a strategic compression zone after the impulse that pushed the price to touch the $80,499 level. The combination of Binance’s Order Book and Coinglass’s Liquidity Heatmap shows us exactly where the “traps” and short-term institutional targets are positioned.
Technical Analysis and Order Flow
Executed Liquidity Sweep: The rise toward $80.5K absorbed much of the liquidation of Shorts in the upper zone. Since there wasn’t continued buying volume to hold above $80,000, the price reacted downward, seeking stabilization.
Immediate Support Point: In the open orders, we see a buy wall protecting $79,300. This level acts as the first operational support to prevent a free-fall toward the consolidation floor.
Lower Liquidity Magnet: In the heatmap, the brightest green-yellow band sits between $77,528 and $78,500. If the buying volume loses strength around $79.3K, it’s highly likely the market will quickly sweep toward the $77.8K - $78.0K to clear leveraged Long contracts before defining the next major move.
Scenario Projection
Main Scenario (Rebalancing and Sweep): Sideways range between $78,500 and $80,000. A controlled pullback toward $77,800 would absorb the floating liquidity and build momentum toward the upper liquidation zone at $81,700 - $83,400.
Bullish Confirmation: We need a firm close on the 1H/4H timeframes above $80,500 to invalidate the immediate selling pressure.
Communities, but your support:
👍 Like this if you found this visual liquidity analysis useful.
➕ If you follow me, I’ll follow you back! Let’s support each other as creators to keep growing and monetize together on the platform. 🚀💰
#Bitcoin #BTC #CryptoAnalysis #USDT $BTC
The Bitcoin market ($BTC ) has entered a strategic compression zone after the impulse that pushed the price to touch the $80,499 level. The combination of Binance’s Order Book and Coinglass’s Liquidity Heatmap shows us exactly where the “traps” and short-term institutional targets are positioned.
Technical Analysis and Order Flow
Executed Liquidity Sweep: The rise toward $80.5K absorbed much of the liquidation of Shorts in the upper zone. Since there wasn’t continued buying volume to hold above $80,000, the price reacted downward, seeking stabilization.
Immediate Support Point: In the open orders, we see a buy wall protecting $79,300. This level acts as the first operational support to prevent a free-fall toward the consolidation floor.
Lower Liquidity Magnet: In the heatmap, the brightest green-yellow band sits between $77,528 and $78,500. If the buying volume loses strength around $79.3K, it’s highly likely the market will quickly sweep toward the $77.8K - $78.0K to clear leveraged Long contracts before defining the next major move.
Scenario Projection
Main Scenario (Rebalancing and Sweep): Sideways range between $78,500 and $80,000. A controlled pullback toward $77,800 would absorb the floating liquidity and build momentum toward the upper liquidation zone at $81,700 - $83,400.
Bullish Confirmation: We need a firm close on the 1H/4H timeframes above $80,500 to invalidate the immediate selling pressure.
Communities, but your support:
👍 Like this if you found this visual liquidity analysis useful.
➕ If you follow me, I’ll follow you back! Let’s support each other as creators to keep growing and monetize together on the platform. 🚀💰
#Bitcoin #BTC #CryptoAnalysis #USDT $BTC