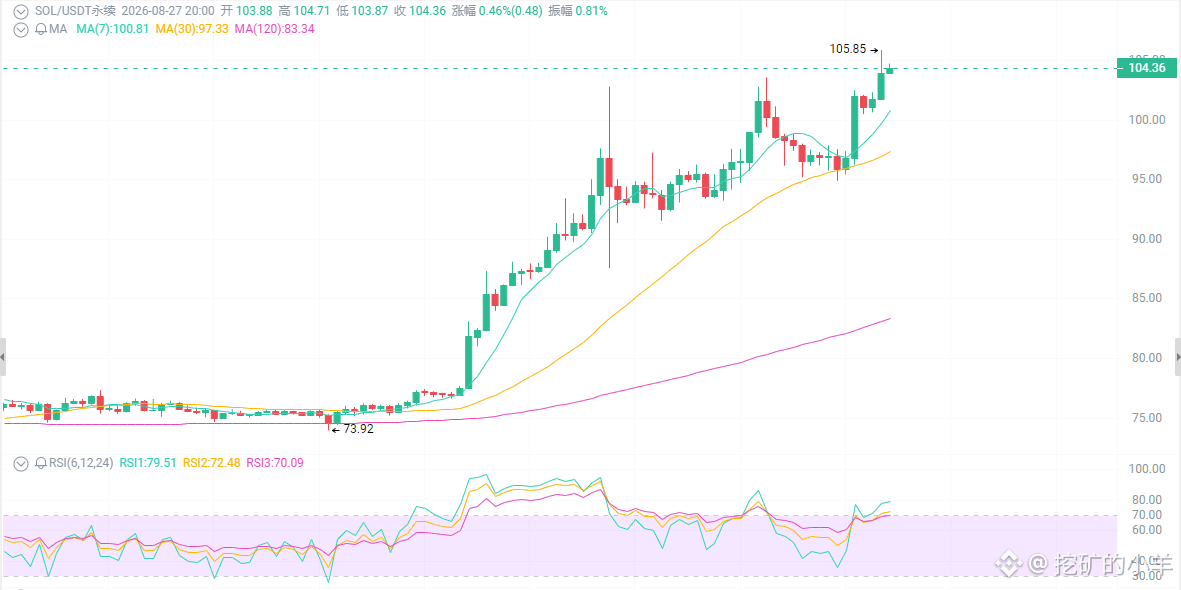
$104 worth of SOL—dare you to chase it?
First, the surface story: a V-shaped reversal with momentum surging.
In June it was around 65; by late July it hit 76. In August it kept breaking through 80, 90, and 100. In just seven days it rose 20%, and in 30 days it’s up 40%. It’s now above the EMA200, with the moving averages aligned bullishly. But the daily RSI is already at 80–85, and price is sitting right on the upper Bollinger Band at 105. The candles are telling you: the trend is right, but the location is expensive.
First thing: the ETF is buying, and on-chain activity is running—this isn’t just idle rotation.
SOL spot ETF cumulative net inflows are about $1.22 billion. On August 25, the single-day inflow was $33.5 million, the largest single day since 2026. In July alone, total network trading was about 4.2 billion transactions, a huge week-over-week spike. Dormant “whale” addresses that had been quiet for two years bought 96,000 SOL—about $9.74 million.
SOL now looks exactly like BNB in 2021: explosive on-chain activity while the price is only just crawling out of the bottom—most people still haven’t fully reacted.
Second thing: tokenomics are moving toward “accelerated deflation,” but many people don’t get it.
SIMD-553: the calculation-unit transaction fee burn is already live. SIMD-550: the proposal discussed speeding annual deflation from -15% to -30%, meaning terminal 1.5% inflation could arrive as early as the first half of 2029.
SOL’s circulating supply is accelerating its reduction.
Fee burn is already absorbing supply.
If the proposal passes, SOL could become one of the assets “scarcer than BTC.”
Third thing: a technical signal has appeared that must be taken seriously.
The 8/22 candle surged to 102, then got smashed back to 93—classic failed breakout. But on 8/25–27, it again held above 100 and pushed up to 105, with the second attempt at 105 having stronger force than the first.
105 is the upper Bollinger Band plus prior overhead resistance. It has hit it twice already—but don’t forget: on the third attempt, that’s often the real breakout.
Resistance above: 105–107 → 110 → 118–122
Support below: 100 (psychological) → 96–97 (first line) → 91–94 (structural support)
Trading playbook
For short-term traders:
Don’t chase at 104–106. Wait for a pullback to 100–101 to go long. Stop-loss: 94.8. Targets: 110–118.
For breakout traders:
If the daily close holds above 107, buy the breakout and target 110–118. If it pulls back to 104–105 without breaking, add. If the close drops back below 103, treat it as a false breakout and exit immediately.
For existing position holders (longs from 90–98):
Cut 30–50% at 104–106, keep the core for 110. Reduce leverage before Friday’s speech.
For naked shorts? Not recommended. The trend is still intact—shorting against the trend can easily get squeezed. Only consider a small-size rebound short around 96 if you see a daily long upper wick with volume stalling, followed by a breakdown below 100.
First, the surface story: a V-shaped reversal with momentum surging.
In June it was around 65; by late July it hit 76. In August it kept breaking through 80, 90, and 100. In just seven days it rose 20%, and in 30 days it’s up 40%. It’s now above the EMA200, with the moving averages aligned bullishly. But the daily RSI is already at 80–85, and price is sitting right on the upper Bollinger Band at 105. The candles are telling you: the trend is right, but the location is expensive.
First thing: the ETF is buying, and on-chain activity is running—this isn’t just idle rotation.
SOL spot ETF cumulative net inflows are about $1.22 billion. On August 25, the single-day inflow was $33.5 million, the largest single day since 2026. In July alone, total network trading was about 4.2 billion transactions, a huge week-over-week spike. Dormant “whale” addresses that had been quiet for two years bought 96,000 SOL—about $9.74 million.
SOL now looks exactly like BNB in 2021: explosive on-chain activity while the price is only just crawling out of the bottom—most people still haven’t fully reacted.
Second thing: tokenomics are moving toward “accelerated deflation,” but many people don’t get it.
SIMD-553: the calculation-unit transaction fee burn is already live. SIMD-550: the proposal discussed speeding annual deflation from -15% to -30%, meaning terminal 1.5% inflation could arrive as early as the first half of 2029.
SOL’s circulating supply is accelerating its reduction.
Fee burn is already absorbing supply.
If the proposal passes, SOL could become one of the assets “scarcer than BTC.”
Third thing: a technical signal has appeared that must be taken seriously.
The 8/22 candle surged to 102, then got smashed back to 93—classic failed breakout. But on 8/25–27, it again held above 100 and pushed up to 105, with the second attempt at 105 having stronger force than the first.
105 is the upper Bollinger Band plus prior overhead resistance. It has hit it twice already—but don’t forget: on the third attempt, that’s often the real breakout.
Resistance above: 105–107 → 110 → 118–122
Support below: 100 (psychological) → 96–97 (first line) → 91–94 (structural support)
Trading playbook
For short-term traders:
Don’t chase at 104–106. Wait for a pullback to 100–101 to go long. Stop-loss: 94.8. Targets: 110–118.
For breakout traders:
If the daily close holds above 107, buy the breakout and target 110–118. If it pulls back to 104–105 without breaking, add. If the close drops back below 103, treat it as a false breakout and exit immediately.
For existing position holders (longs from 90–98):
Cut 30–50% at 104–106, keep the core for 110. Reduce leverage before Friday’s speech.
For naked shorts? Not recommended. The trend is still intact—shorting against the trend can easily get squeezed. Only consider a small-size rebound short around 96 if you see a daily long upper wick with volume stalling, followed by a breakdown below 100.