ONG IS RECOVERING AFTER A MAJOR EXPANSION
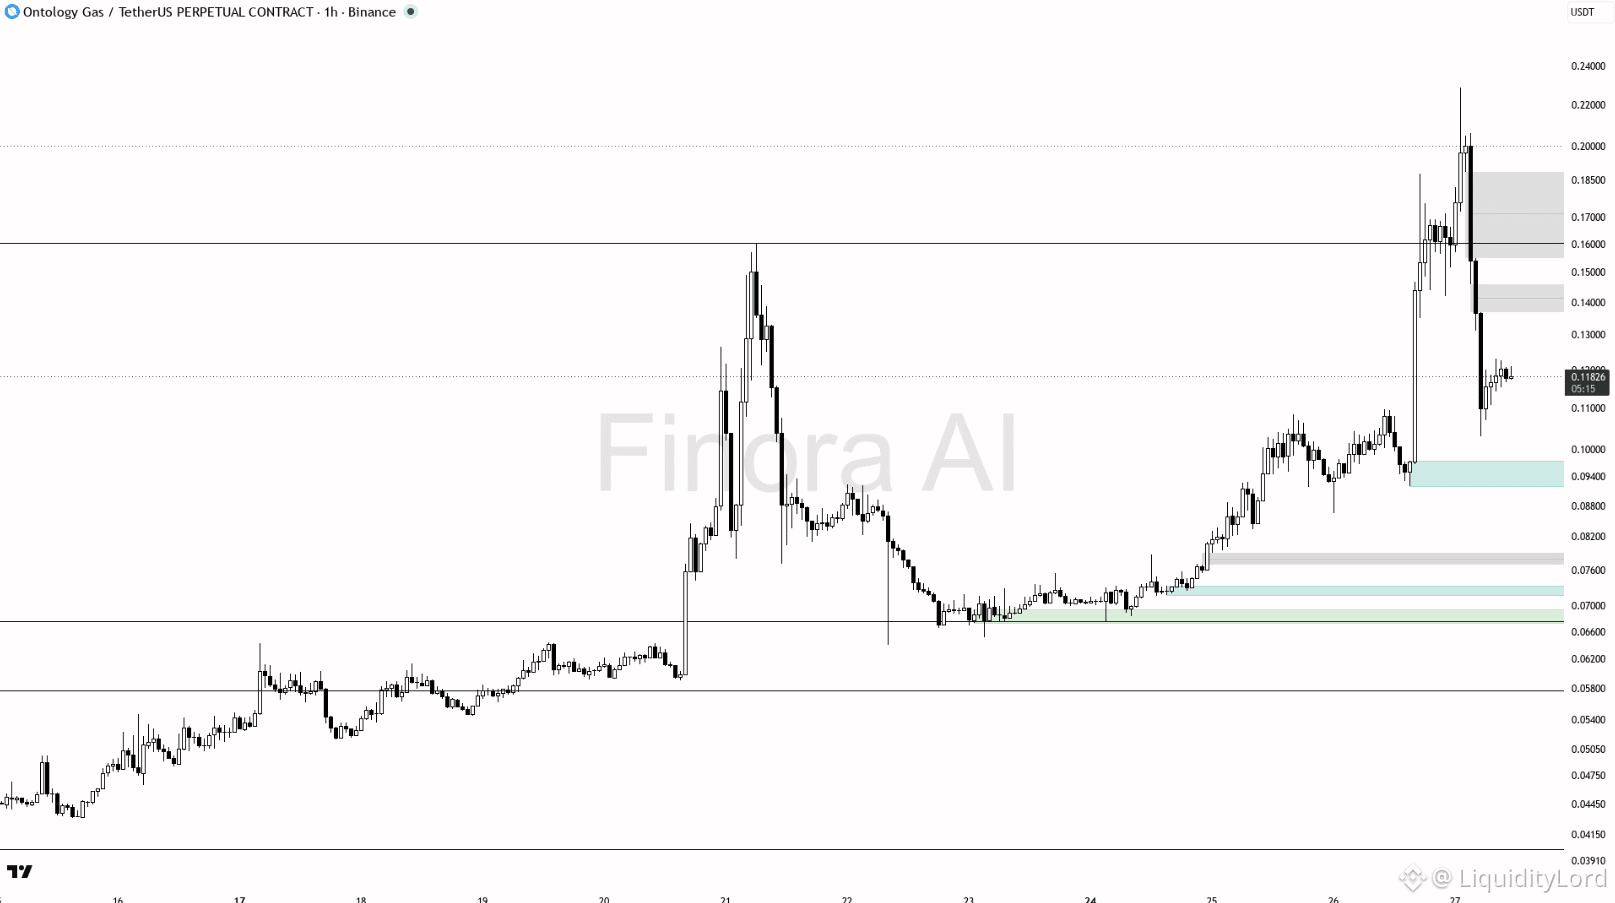
ONG trades around 0.118 on the 1h chart after a sharp move from the 0.066-0.072 base. Price surged above 0.16 and briefly reached 0.22 before a fast correction.
📊 STRUCTURE CHECK
The expansion broke several prior resistance levels, but the rejection from 0.22 shows that sellers are still active above 0.16. Price is now stabilizing around 0.11-0.12 after the pullback.
The key recovery zone is 0.14-0.16. Reclaiming this area would improve the structure and reopen the path toward the recent high.
🎯 TARGET MAP
TP1: 0.140
TP2: 0.160
TP3: 0.185
Stop Loss: 0.095
TP1 is the first recovery checkpoint. TP2 is the main resistance zone, while TP3 represents the next upside extension if momentum returns.
⚠ INVALIDATION
The bullish setup weakens if ONG loses 0.095 and fails to reclaim it. A deeper move toward 0.072 would damage the current recovery structure and return price to the previous demand area.
🧩 EXECUTION DYNAMICS
STONfi is relevant to execution, not the ONG thesis. After a vertical expansion and sharp retracement, liquidity can become fragmented as participants reposition around new price levels. RFQ-based routing allows competing resolvers to search available liquidity and compare quotes for efficient execution.
This becomes more relevant when volatility expands because spreads and depth can change quickly. STONfi does not determine ONG's direction; the chart defines the thesis, while execution focuses on accessing competitive liquidity.
TON remains the broader ecosystem reference, while ONG requires independent confirmation from price action.
🔎 MY PLAN
I would not chase the rebound near 0.12. My preferred setup is a controlled move into 0.14-0.16 followed by acceptance above that zone. If buyers reclaim it, 0.185 becomes the next target.
If ONG loses 0.095, I would step aside and wait for a stronger base.
$ONG
ONG trades around 0.118 on the 1h chart after a sharp move from the 0.066-0.072 base. Price surged above 0.16 and briefly reached 0.22 before a fast correction.
📊 STRUCTURE CHECK
The expansion broke several prior resistance levels, but the rejection from 0.22 shows that sellers are still active above 0.16. Price is now stabilizing around 0.11-0.12 after the pullback.
The key recovery zone is 0.14-0.16. Reclaiming this area would improve the structure and reopen the path toward the recent high.
🎯 TARGET MAP
TP1: 0.140
TP2: 0.160
TP3: 0.185
Stop Loss: 0.095
TP1 is the first recovery checkpoint. TP2 is the main resistance zone, while TP3 represents the next upside extension if momentum returns.
⚠ INVALIDATION
The bullish setup weakens if ONG loses 0.095 and fails to reclaim it. A deeper move toward 0.072 would damage the current recovery structure and return price to the previous demand area.
🧩 EXECUTION DYNAMICS
STONfi is relevant to execution, not the ONG thesis. After a vertical expansion and sharp retracement, liquidity can become fragmented as participants reposition around new price levels. RFQ-based routing allows competing resolvers to search available liquidity and compare quotes for efficient execution.
This becomes more relevant when volatility expands because spreads and depth can change quickly. STONfi does not determine ONG's direction; the chart defines the thesis, while execution focuses on accessing competitive liquidity.
TON remains the broader ecosystem reference, while ONG requires independent confirmation from price action.
🔎 MY PLAN
I would not chase the rebound near 0.12. My preferred setup is a controlled move into 0.14-0.16 followed by acceptance above that zone. If buyers reclaim it, 0.185 becomes the next target.
If ONG loses 0.095, I would step aside and wait for a stronger base.
$ONG