
King of Indicators MACD—are you still using traditional methods?
Most of what you see online teaches you to read MACD by telling you: buy when a golden cross forms, and sell when a death cross forms. But there’s a big problem with this approach—there’s too much delay. By the time the crossover appears, the stock has already climbed 10%+!!!
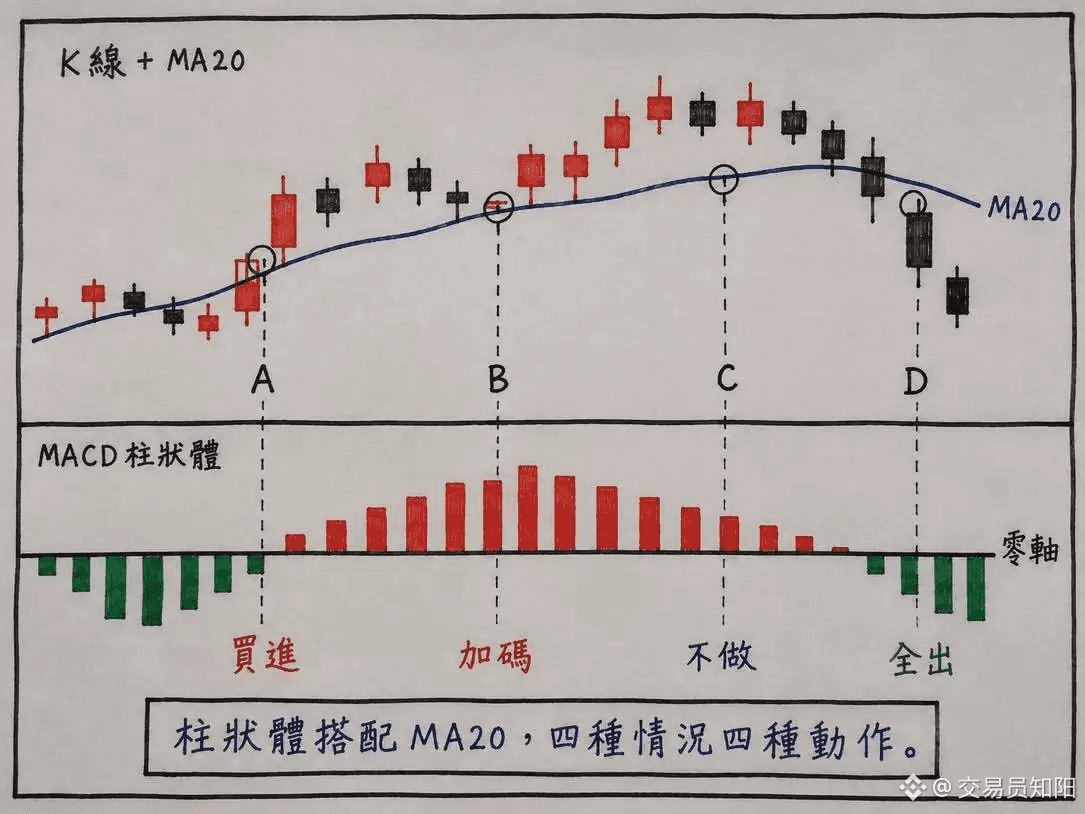
First type: The histogram bars turn from green to red, and the stock price also moves above the MA20—this is the most standard entry signal.
Second type: The histogram shortens above the zero line and then grows longer again, and backtesting shows the price doesn’t break below the MA20—this is the add-on signal.
Third type: The histogram turns red, but the stock price is still below the MA20—this is a rebound, not a reversal. Don’t place a trade.
Fourth type: The histogram clearly shortens above the zero line, and meanwhile the stock price breaks below the MA20—this is an escape/exit signal. Sell everything before the end of the trading day.
MACD can look different to everyone, and I hope this gives everyone some reference.
(But the most direct factors in the market are volume and price, naked candlesticks, and price action #韩国央行加息25基点至3% )
Most of what you see online teaches you to read MACD by telling you: buy when a golden cross forms, and sell when a death cross forms. But there’s a big problem with this approach—there’s too much delay. By the time the crossover appears, the stock has already climbed 10%+!!!
First type: The histogram bars turn from green to red, and the stock price also moves above the MA20—this is the most standard entry signal.
Second type: The histogram shortens above the zero line and then grows longer again, and backtesting shows the price doesn’t break below the MA20—this is the add-on signal.
Third type: The histogram turns red, but the stock price is still below the MA20—this is a rebound, not a reversal. Don’t place a trade.
Fourth type: The histogram clearly shortens above the zero line, and meanwhile the stock price breaks below the MA20—this is an escape/exit signal. Sell everything before the end of the trading day.
MACD can look different to everyone, and I hope this gives everyone some reference.
(But the most direct factors in the market are volume and price, naked candlesticks, and price action #韩国央行加息25基点至3% )