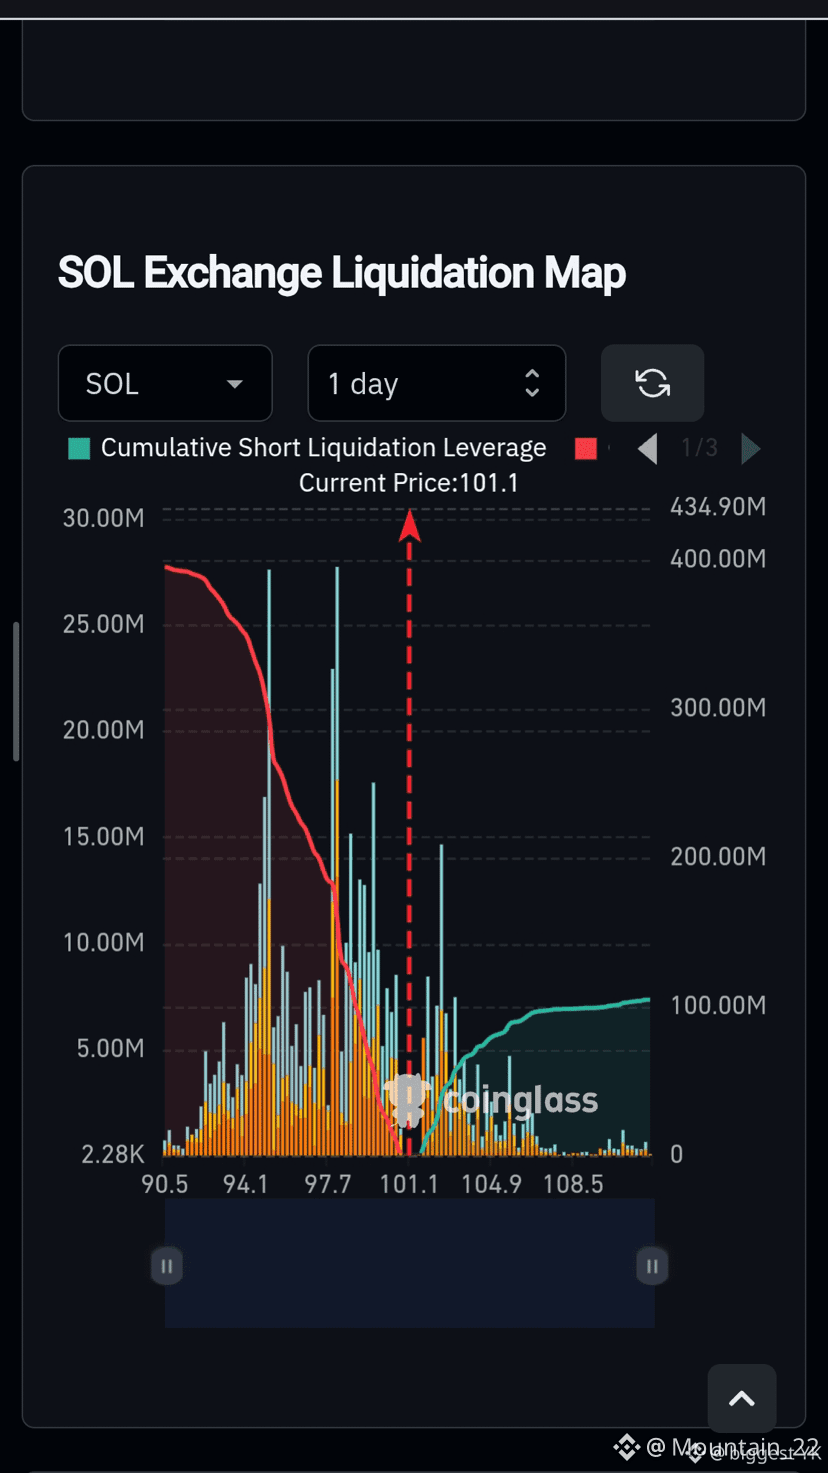
$SOL LIQUIDATION MAP SHOWS INTERESTING SETTINGS 👀
Right now, SOL is approximately at $101.1.
Let's take a look at the 1-day liquidation map from Coinglass:
🔴 Below $101:
There’s a much higher concentration of potential liquidations for long positions, especially in the $94–$98 area and lower.
🟢 Above $101:
Liquidity for short liquidations starts building as SOL moves higher, with noticeable clusters around $103–$106+.
What’s important:
If SOL breaks above and momentum accelerates, liquidity for shorts above the price can fuel a short squeeze, since the involved shorts will be forced to close.
But there’s a significantly larger pool of liquidations from below — below the current price.
So the map effectively suggests:
$103–$106 → potential short-squeeze zone
$94–$98 → main liquidation zone for long positions
The liquidation map DOES NOT predict direction by itself. It shows where leverage could amplify the move.
I’d watch the $101–$103 range closely in the near-term expansion.
Do you expect SOL to “hunt” shorts above or long positions below? 👇
Right now, SOL is approximately at $101.1.
Let's take a look at the 1-day liquidation map from Coinglass:
🔴 Below $101:
There’s a much higher concentration of potential liquidations for long positions, especially in the $94–$98 area and lower.
🟢 Above $101:
Liquidity for short liquidations starts building as SOL moves higher, with noticeable clusters around $103–$106+.
What’s important:
If SOL breaks above and momentum accelerates, liquidity for shorts above the price can fuel a short squeeze, since the involved shorts will be forced to close.
But there’s a significantly larger pool of liquidations from below — below the current price.
So the map effectively suggests:
$103–$106 → potential short-squeeze zone
$94–$98 → main liquidation zone for long positions
The liquidation map DOES NOT predict direction by itself. It shows where leverage could amplify the move.
I’d watch the $101–$103 range closely in the near-term expansion.
Do you expect SOL to “hunt” shorts above or long positions below? 👇