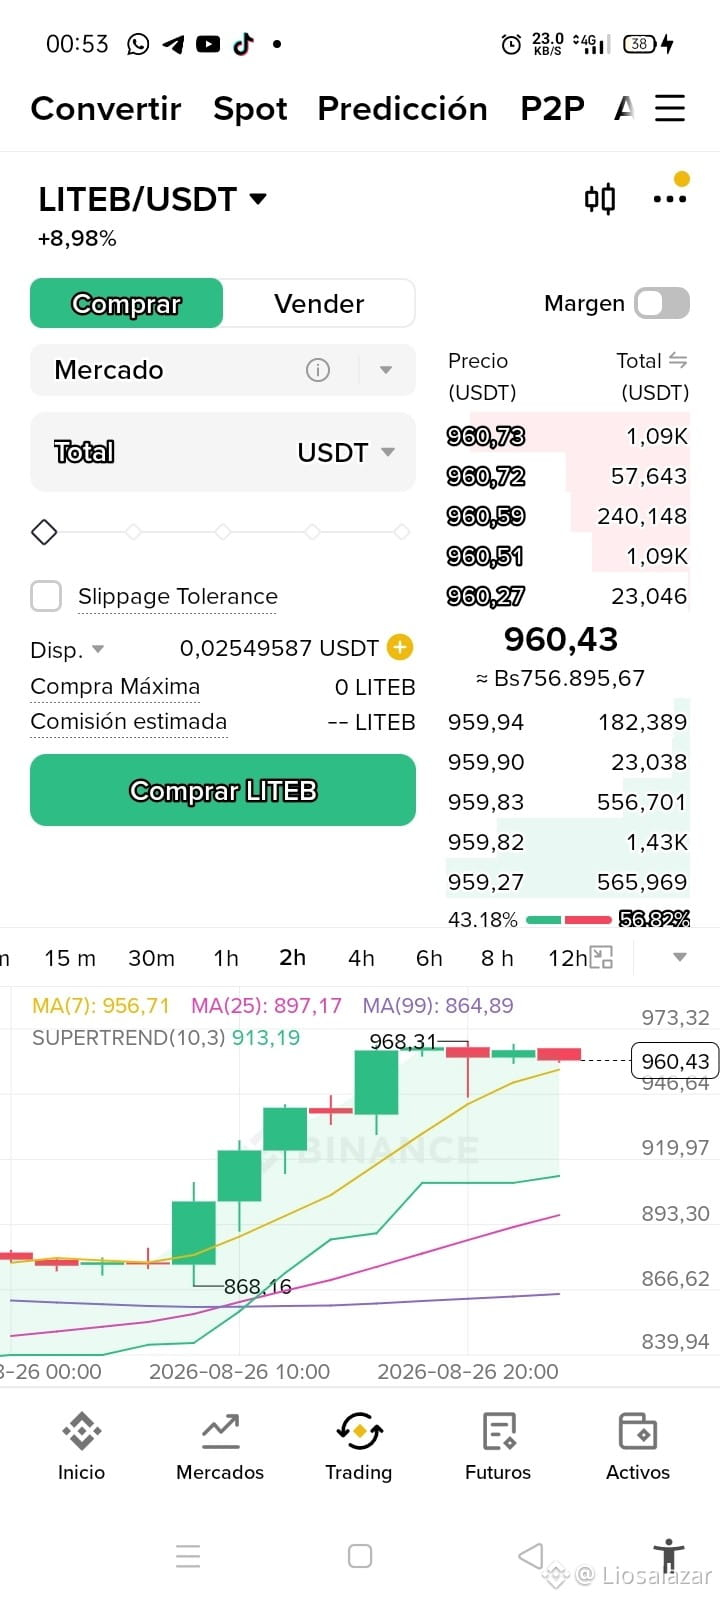
Technical Analysis: LITEB/USDT (Lite Strategy bStocks) on the 2-Hour timeframe
Analysis of the LITEB/USDT pair, which shows a strong bullish move (+8.98%), consolidating near its recent high after breaking through the short-, medium-, and long-term moving averages with force.
Key market data:
Current price: 960.43 USDT (+8.98%).
Order book (Depth): Moderate sell pressure in the upper zone with 56.82% versus 43.18% from buyers.
Key technical levels and indicators (2h):
Moving Averages:
MA(7): 956.71 USDT (dynamic immediate support for the short term).
MA(25): 897.17 USDT (main technical support for the medium term).
MA(99): 864.89 USDT (structural support for the long term).
SuperTrend (10,3): Remains bullish (green), setting its defensive floor at 913.19 USDT.
Reference points:
Local resistance: Prior top recorded at the wick at 968.31 USDT.
Key defensive support: The impulse floor at 868.16 USDT.
Outlook:
LITEB shows strong buyer dominance on the 2-hour chart. The rally took off from the 868.16 USDT support, then successively broke above the MA(99) and MA(25), and activated the SuperTrend in bullish territory until it reached a high at 968.31 USDT.
Currently, the price is consolidating the gain above 960 USDT, staying above the MA(7) at 956.71 USDT. If buyers manage to hold the MA(7) support, the price will attempt to break the 968.31 USDT ceiling to project an advance toward the psychological 1,000 USDT zone. In case of a corrective profit-taking move, the first defensive floor to monitor is at 956.71 USDT (MA7), followed by the SuperTrend zone at 913.19 USDT.
(Disclaimer: Informational content structured for Binance Square. It does not constitute financial or investment advice. Always do your own research).
#TradFi #LITEB #bStocks #BinanceSquare #TechnicalAnalysis
Analysis of the LITEB/USDT pair, which shows a strong bullish move (+8.98%), consolidating near its recent high after breaking through the short-, medium-, and long-term moving averages with force.
Key market data:
Current price: 960.43 USDT (+8.98%).
Order book (Depth): Moderate sell pressure in the upper zone with 56.82% versus 43.18% from buyers.
Key technical levels and indicators (2h):
Moving Averages:
MA(7): 956.71 USDT (dynamic immediate support for the short term).
MA(25): 897.17 USDT (main technical support for the medium term).
MA(99): 864.89 USDT (structural support for the long term).
SuperTrend (10,3): Remains bullish (green), setting its defensive floor at 913.19 USDT.
Reference points:
Local resistance: Prior top recorded at the wick at 968.31 USDT.
Key defensive support: The impulse floor at 868.16 USDT.
Outlook:
LITEB shows strong buyer dominance on the 2-hour chart. The rally took off from the 868.16 USDT support, then successively broke above the MA(99) and MA(25), and activated the SuperTrend in bullish territory until it reached a high at 968.31 USDT.
Currently, the price is consolidating the gain above 960 USDT, staying above the MA(7) at 956.71 USDT. If buyers manage to hold the MA(7) support, the price will attempt to break the 968.31 USDT ceiling to project an advance toward the psychological 1,000 USDT zone. In case of a corrective profit-taking move, the first defensive floor to monitor is at 956.71 USDT (MA7), followed by the SuperTrend zone at 913.19 USDT.
(Disclaimer: Informational content structured for Binance Square. It does not constitute financial or investment advice. Always do your own research).
#TradFi #LITEB #bStocks #BinanceSquare #TechnicalAnalysis