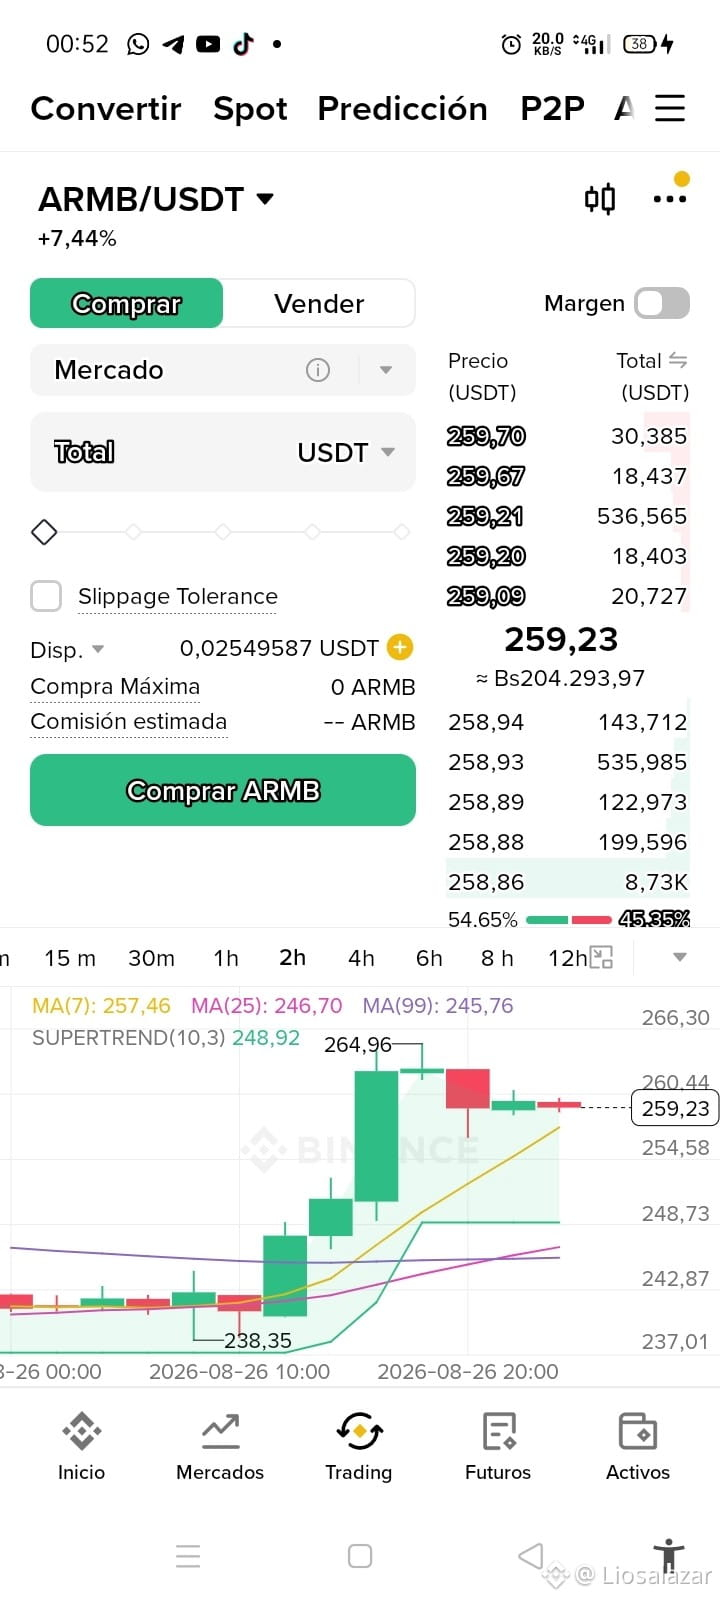
Technical analysis: ARMB/USDT (ARM bStocks) on the 2-hour timeframe
Analysis of the ARMB/USDT pair, which shows a strong bullish move (+7.44%), consolidating in the upper zone after comfortably overlapping its key moving averages and the SuperTrend indicator.
Key market data:
Current price: 259.23 USDT (+7.44%).
Order book (Depth): Buyer dominance of 54.65% versus 45.35% sellers.
Key technical levels and indicators (2h):
Moving Averages:
MA(7): 257.46 USDT (dynamic immediate support for the short term).
MA(25): 246.70 USDT (main technical support for the medium term).
MA(99): 245.76 USDT (long-term structural support).
SuperTrend (10,3): Remains bullish (green), placing its defensive floor at 248.92 USDT.
Reference points:
Local resistance: Prior high recorded at the wick of 264.96 USDT.
Key defensive support: Floor of the impulse at 238.35 USDT.
Outlook:
ARMB shows a powerful buying momentum on the 2-hour chart. After breaking the prior compression zone near $245.00, the asset extended an uptrend rally that pushed the price to mark a local high at 264.96 USDT.
Currently, the price is experiencing healthy consolidation around 259.23 USDT, holding above the MA(7) at 257.46 USDT. The depth of the order book maintains a buy bias (54.65%). To seek a resumption of the trend and a new attempt toward 264.96 USDT, the market needs to keep 2-hour closes above the MA(7). If a broader corrective pullback occurs, the key defensive zone aligns between the bullish SuperTrend and the MA(25) in the 246.70 - 248.92 USDT range.
(Disclaimer: Informational content structured for Binance Square. It does not constitute financial or investment advice. Always do your own research).
#TradFi #ARMB #ARM #bStocks #BinanceSquare #TechnicalAnalysis
Analysis of the ARMB/USDT pair, which shows a strong bullish move (+7.44%), consolidating in the upper zone after comfortably overlapping its key moving averages and the SuperTrend indicator.
Key market data:
Current price: 259.23 USDT (+7.44%).
Order book (Depth): Buyer dominance of 54.65% versus 45.35% sellers.
Key technical levels and indicators (2h):
Moving Averages:
MA(7): 257.46 USDT (dynamic immediate support for the short term).
MA(25): 246.70 USDT (main technical support for the medium term).
MA(99): 245.76 USDT (long-term structural support).
SuperTrend (10,3): Remains bullish (green), placing its defensive floor at 248.92 USDT.
Reference points:
Local resistance: Prior high recorded at the wick of 264.96 USDT.
Key defensive support: Floor of the impulse at 238.35 USDT.
Outlook:
ARMB shows a powerful buying momentum on the 2-hour chart. After breaking the prior compression zone near $245.00, the asset extended an uptrend rally that pushed the price to mark a local high at 264.96 USDT.
Currently, the price is experiencing healthy consolidation around 259.23 USDT, holding above the MA(7) at 257.46 USDT. The depth of the order book maintains a buy bias (54.65%). To seek a resumption of the trend and a new attempt toward 264.96 USDT, the market needs to keep 2-hour closes above the MA(7). If a broader corrective pullback occurs, the key defensive zone aligns between the bullish SuperTrend and the MA(25) in the 246.70 - 248.92 USDT range.
(Disclaimer: Informational content structured for Binance Square. It does not constitute financial or investment advice. Always do your own research).
#TradFi #ARMB #ARM #bStocks #BinanceSquare #TechnicalAnalysis