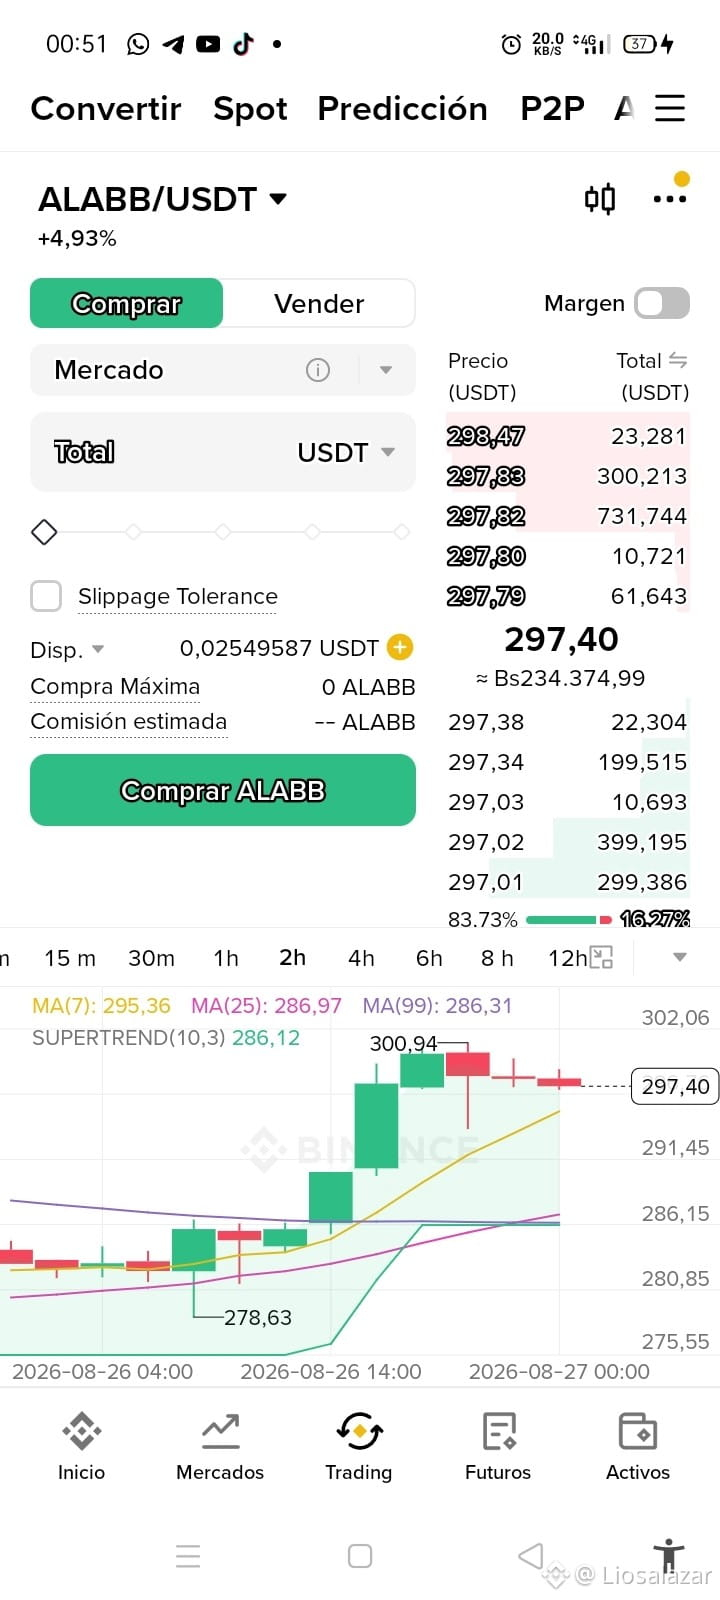
Technical analysis: ALABB/USDT (Alibaba bStocks) on the 2-hour timeframe
Analysis of the ALABB/USDT pair, which consolidates its recent gains (+4.93%) after a strong bullish impulse pushed the asset above 300 USDT and placed it comfortably above its moving averages.
Key market data:
Current price: 297.40 USDT (+4.93%).
Order book (Depth): Marked buy-side support of 83.73% versus 16.27% sell-side.
Key technical levels and indicators (2h):
Moving Averages:
MA(7): 295.36 USDT (dynamic and immediate short-term support).
MA(25): 286.97 USDT (key medium-term technical support).
MA(99): 286.31 USDT (long-term structural support).
SuperTrend (10,3): Remains bullish (green), setting its defensive base at 286.12 USDT.
Reference points:
Local resistance: Recent high at the wick around 300.94 USDT.
Key defensive support: The impulse floor at 278.63 USDT.
Outlook:
ALABB maintains a clear bullish momentum on the 2-hour chart. After breaking the prior accumulation zone and crossing the medium- and long-term averages (MA25 and MA99), the price marked a local high at 300.94 USDT.
Currently, the asset is experiencing a slight healthy pause below 300 USDT, holding above the MA(7) at 295.36 USDT. The depth of the order book shows a strong buying presence (83.73%), supporting the possibility of resuming the push toward 300.94 USDT. If the market needs a deeper correction, the main defensive zone is reinforced by the confluence of the MA(25), MA(99), and SuperTrend around 286.00 - 286.97 USDT.
(Disclaimer: Informational content structured for Binance Square. This does not constitute financial or investment advice. Always do your own research).
#TradFi #ALABB #Alibaba #bStocks #BinanceSquare #TechnicalAnalysis
Analysis of the ALABB/USDT pair, which consolidates its recent gains (+4.93%) after a strong bullish impulse pushed the asset above 300 USDT and placed it comfortably above its moving averages.
Key market data:
Current price: 297.40 USDT (+4.93%).
Order book (Depth): Marked buy-side support of 83.73% versus 16.27% sell-side.
Key technical levels and indicators (2h):
Moving Averages:
MA(7): 295.36 USDT (dynamic and immediate short-term support).
MA(25): 286.97 USDT (key medium-term technical support).
MA(99): 286.31 USDT (long-term structural support).
SuperTrend (10,3): Remains bullish (green), setting its defensive base at 286.12 USDT.
Reference points:
Local resistance: Recent high at the wick around 300.94 USDT.
Key defensive support: The impulse floor at 278.63 USDT.
Outlook:
ALABB maintains a clear bullish momentum on the 2-hour chart. After breaking the prior accumulation zone and crossing the medium- and long-term averages (MA25 and MA99), the price marked a local high at 300.94 USDT.
Currently, the asset is experiencing a slight healthy pause below 300 USDT, holding above the MA(7) at 295.36 USDT. The depth of the order book shows a strong buying presence (83.73%), supporting the possibility of resuming the push toward 300.94 USDT. If the market needs a deeper correction, the main defensive zone is reinforced by the confluence of the MA(25), MA(99), and SuperTrend around 286.00 - 286.97 USDT.
(Disclaimer: Informational content structured for Binance Square. This does not constitute financial or investment advice. Always do your own research).
#TradFi #ALABB #Alibaba #bStocks #BinanceSquare #TechnicalAnalysis