


Hello everyone, I am Lao Liu.
Today is August 27, 2026
Thursday
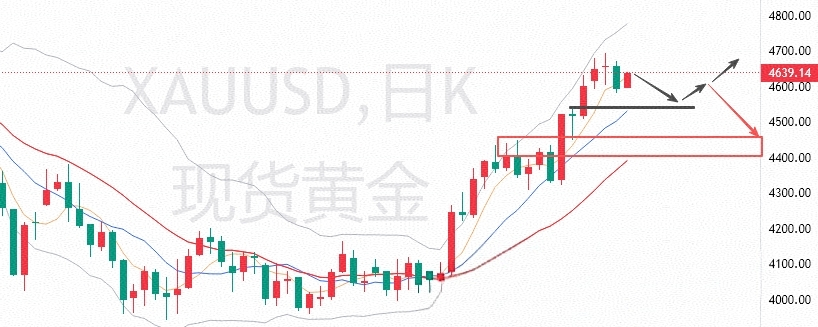
Gold began to trade in a choppy corrective pattern from yesterday’s early session and continued to repair. After the U.S. PCE data was released in the evening, price fell again, breaking through 4600 and dropping to around 4583. On the daily chart, it closed with a solid, heavy bearish candle, breaking below the 5-day moving average support.
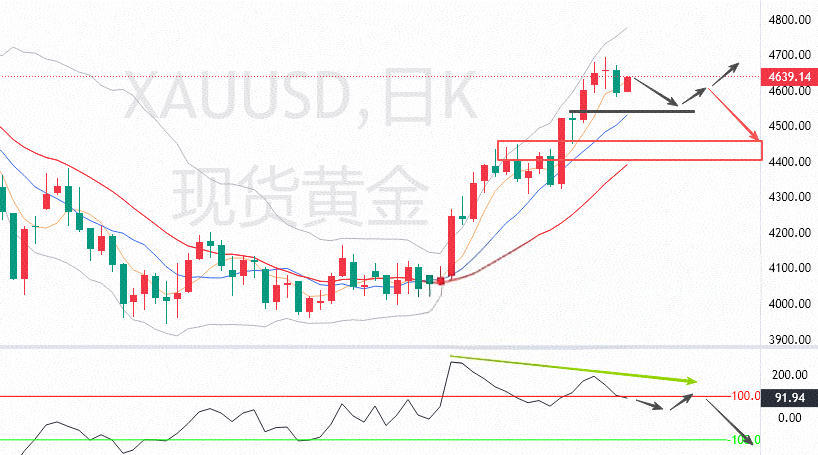
From the daily structure, the bearish candle collected yesterday is quite similar in shape to the bearish candle on August 13. Technically, using the influence of this bearish candle, gold should still have room for a further pullback and adjustment in the short term. At minimum, it should test the 10-day moving average support at least once below. However, after the market opened this morning, gold has instead stabilized and rebounded. The current price is now back above the 5-day moving average again. The overly excited and reactive behavior of the bulls suggests that today’s intraday trend may not be as calm as one might imagine.
However, due to the influence of the top bearish divergence on the daily timeframe, in the short term gold may still have further downside. So even if there is currently a rebound, the upside is still relatively difficult, with limited room.
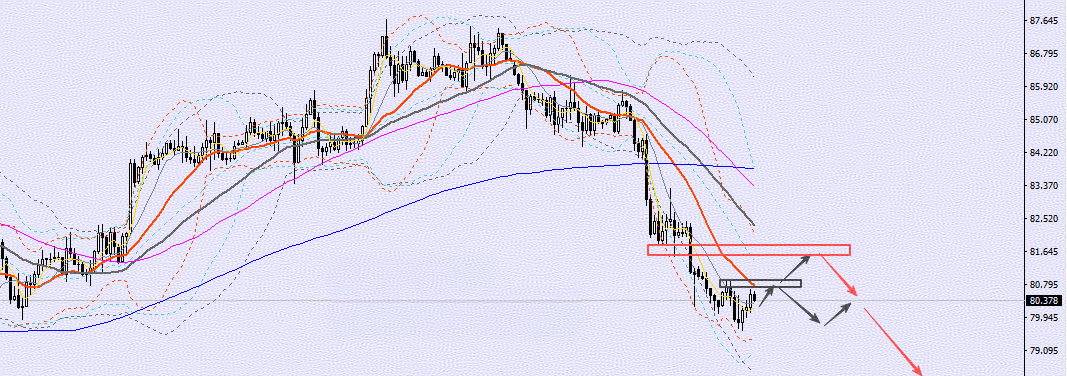
Combined with the hour-chart structure, the overnight move has already fallen back below the moving-average band, and the moving-average band is also dispersing in a bearish manner. Yet this morning’s price action suddenly flipped upward back into the moving-average band. Such an abnormal move also increases the risk of uncertainty in today’s price action.
Intraday, you can watch the upper end of the hour-chart level range around 4645 for a test; this is also the pressure area of the hour-chart trendline. If the Asia session price action continues to be erratic, price may once again test the area of yesterday’s high around 4670–4680. However, if there’s no absolutely positive fundamental catalyst, gold will still be very difficult to extend higher.
Intraday, continue to focus on the 4600 psychological level for contention on the downside, as well as around 4580 near the lower end of the hour-chart range. Technically, the possibility of a later pullback toward around 4520 is still retained. Also, the 10-day moving average support is currently around 4630. So you can treat the 4630–4620 area as the main target zone for this round’s corrective movement.
In terms of operations, given that the bearish divergence top on the gold daily timeframe is still present and the daily trend is also tending toward further correction and pullback, the main intraday line of thought should still be to look for a corrective pullback. Any rebound caused by early-session anomalies shouldn’t be chased—use the rebound to attempt short positions for a short-term profit.
If you’re aggressive intraday, you can take a very small-size short trade around 4645. For now, place a manual stop loss above 4650. Targets are on the downside around 4620–4615—reduce positions there to move the stop to break-even. The remaining position can then look toward 4600 and 4580.
If the Asia-session price action continues to rebound and breaks above 4650, I wouldn’t consider chasing longs. Instead, you can wait for another retest around 4670–4680 and then attempt a short position in the short term. The specific strategy still needs real-time adjustments based on live trading.
【Crude Oil Analysis】
Yesterday, WTI first continued with a pullback and corrective move. After falling to around 79.6, it rebounded somewhat. In the evening, after the US EIA data was released, WTI rose and rebounded on this influence. The high temporarily pressured up to around 83.2. Then in the latter part of the night, price gave back again and moved back below 82. In the end, the daily chart closed with a small bullish candle with both upper and lower wicks.
Judging from yesterday’s WTI trading rhythm, the short-term market is still controlled by fundamentals. In the near term, whenever there’s news/fundamental impact, price fluctuations will tend to become more intense. But since news can be hard to read—its reality and timing are hard to discern—this also increases the risk of abnormal moves in the short-term.
So at this stage, from the daily chart structure of WTI, you still can’t see the main direction. If the fundamental picture becomes cool during the second half of the week, then WTI may fall into a sideways trend. As for how the final direction will be chosen, we still need to wait for the specific news/fundamental catalysts.
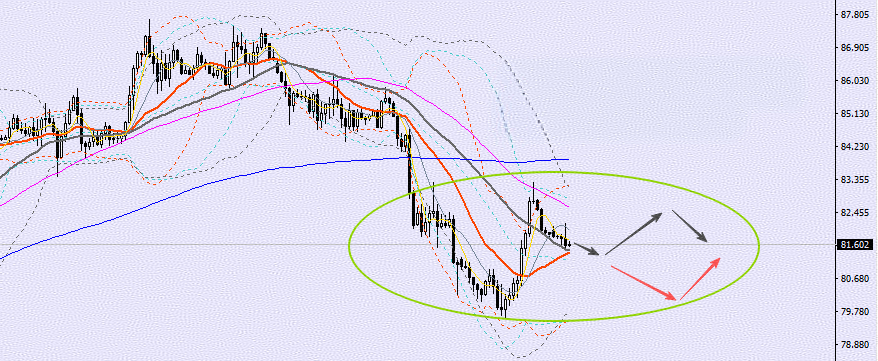
In terms of operations, if you’re aggressive, you can trade short-term long-low and sell-high within the range around it. However, the range has also been expanded at the moment, so the risk of variables on shorter timeframes has increased. Even if you can still trade around the range in the short term, the risk remains.
For the intraday range, watch the resistance around 82.5–83 on the upper side, and the middle band at 81.3–81. On the downside, look at 80–79.7. Even though an aggressive trader can take short-term low-buy and high-sell trades around the above range temporarily, you must also guard against potential news/fundamental impacts at any time.
The above is my personal opinion, for reference only!#黄金