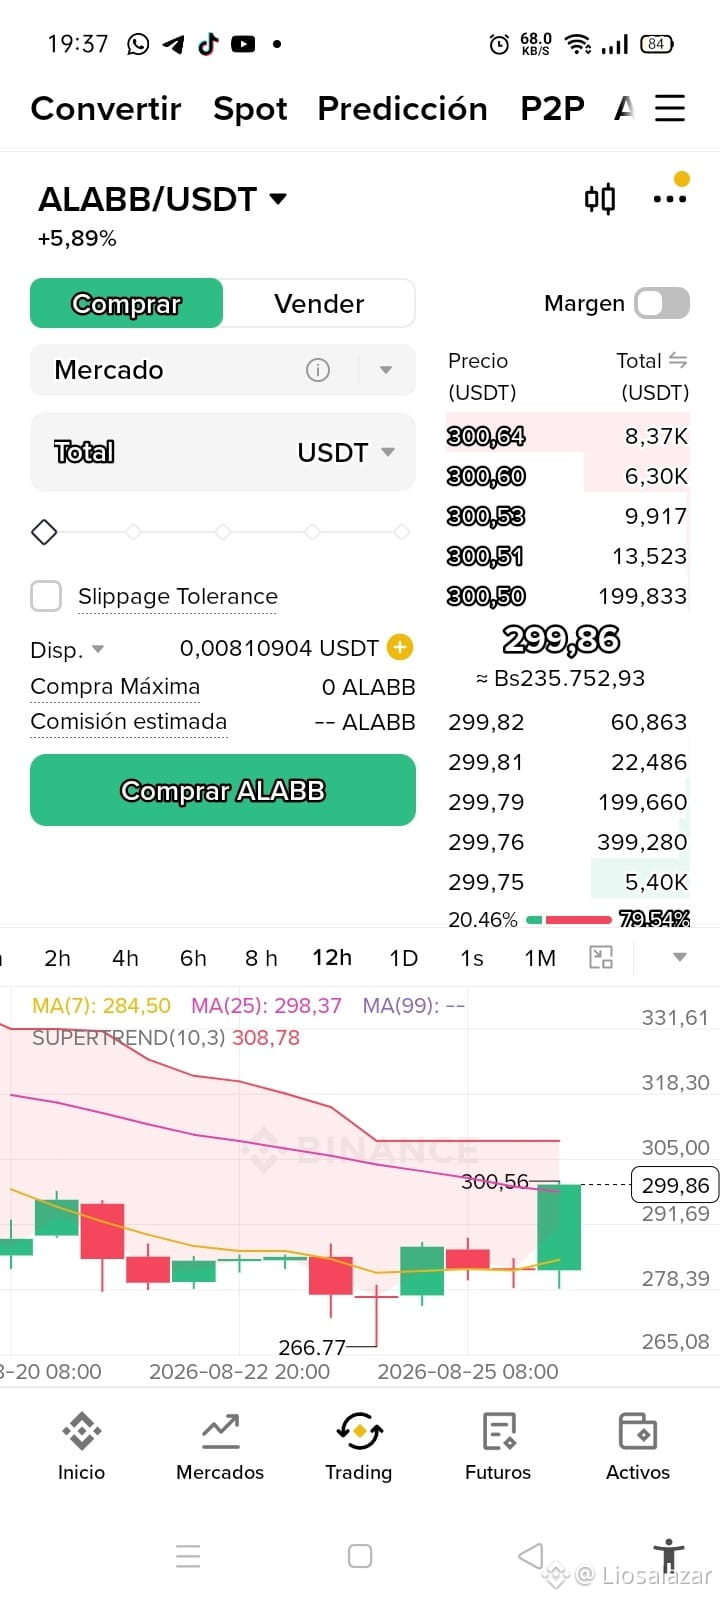
Technical Analysis: ALABB/USDT (Alibaba bStocks) on the 12-Hour timeframe
Analysis of the ALABB/USDT pair, which shows a strong bullish impulse (+5.89%), breaking above the 25-period moving average (MA25) and targeting the psychological barrier of 300 USDT.
Key market data:
Current price: 299.86 USDT (+5.89%).
Order book (Depth): Predominance of selling pressure in the resistance zone with 79.54% versus 20.46% for buyers.
Key technical levels and indicators (12h):
Moving Averages:
MA(7): 284.50 USDT (dynamic and immediate short-term support).
MA(25): 298.37 USDT (dynamic level recently broken by the price).
MA(99): Not available on the chart.
SuperTrend (10,3): Remains bearish (red), setting its defensive upper barrier at 308.78 USDT.
Reference points:
Immediate resistance: Recent high marked by the wick at 300.56 USDT.
Key defensive support: Floor of the move at 266.77 USDT.
Outlook:
ALABB shows a powerful green candle on the 12-hour chart that has allowed it to break the prior compression zone and surpass the MA(25) at 298.37 USDT, reaching a high of 300.56 USDT.
Price is testing the 300.00 USDT resistance area, where the order book reflects a strong concentration of sell offers (79.54%). To consolidate this breakout and continue toward the SuperTrend indicator at 308.78 USDT, buyers need to maintain 12h closes above the MA(25) ($298.37). If 300 USDT is not decisively surpassed and profit-taking occurs, the MA(7) at 284.50 USDT will act as the first major support zone.
(Disclaimer: Informational content structured for Binance Square. It does not constitute financial or investment advice. Always do your own research).
#TradFi #ALABB #Alibaba #bStocks #BinanceSquare #TechnicalAnalysis
Analysis of the ALABB/USDT pair, which shows a strong bullish impulse (+5.89%), breaking above the 25-period moving average (MA25) and targeting the psychological barrier of 300 USDT.
Key market data:
Current price: 299.86 USDT (+5.89%).
Order book (Depth): Predominance of selling pressure in the resistance zone with 79.54% versus 20.46% for buyers.
Key technical levels and indicators (12h):
Moving Averages:
MA(7): 284.50 USDT (dynamic and immediate short-term support).
MA(25): 298.37 USDT (dynamic level recently broken by the price).
MA(99): Not available on the chart.
SuperTrend (10,3): Remains bearish (red), setting its defensive upper barrier at 308.78 USDT.
Reference points:
Immediate resistance: Recent high marked by the wick at 300.56 USDT.
Key defensive support: Floor of the move at 266.77 USDT.
Outlook:
ALABB shows a powerful green candle on the 12-hour chart that has allowed it to break the prior compression zone and surpass the MA(25) at 298.37 USDT, reaching a high of 300.56 USDT.
Price is testing the 300.00 USDT resistance area, where the order book reflects a strong concentration of sell offers (79.54%). To consolidate this breakout and continue toward the SuperTrend indicator at 308.78 USDT, buyers need to maintain 12h closes above the MA(25) ($298.37). If 300 USDT is not decisively surpassed and profit-taking occurs, the MA(7) at 284.50 USDT will act as the first major support zone.
(Disclaimer: Informational content structured for Binance Square. It does not constitute financial or investment advice. Always do your own research).
#TradFi #ALABB #Alibaba #bStocks #BinanceSquare #TechnicalAnalysis