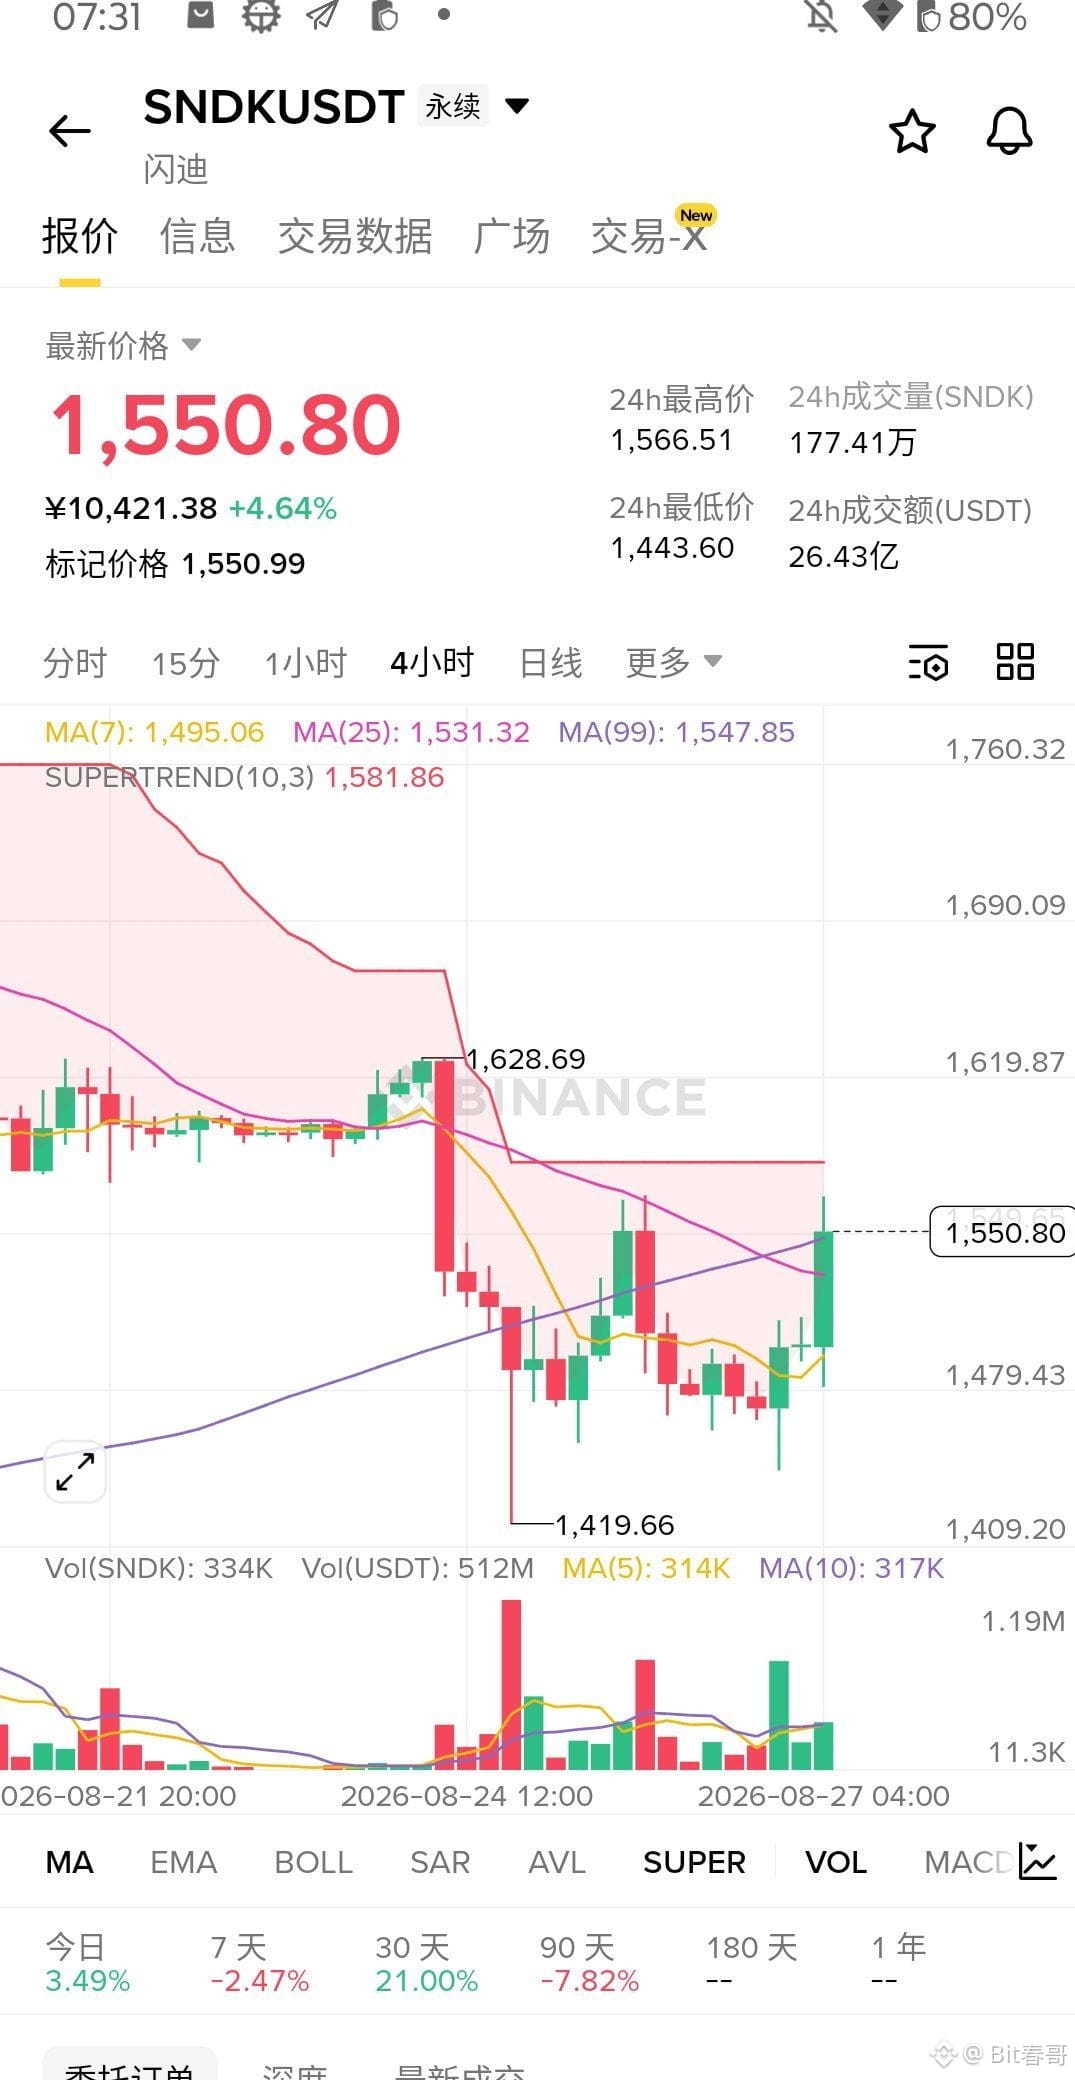
SNDK has broken above the 1511 prior high. In four hours it touched 1566. The chart looks like a breakout, but within the same stretch of action, the proportion of longs that large accounts have piled into fell 15.3% over seven hours. The big money that pushed the price up, instead, is reducing long positions.
The futures order book confirms it even more: over the seven hours during which price made a new high, open interest fell 9.49%, total contract value shrank 6.44%, and aggressive trades were also cut by 12.8%. A real breakout is when positions get stacked thicker and thicker. This tape is the opposite: as price rises, the inventory thins.
Also, this isn’t short covering—if shorts were really being squeezed, the funding rate should have turned negative long ago. But across 8 settlement cycles, 7 closed positive. That means the longs holding positions were long while price was rising, steadily reducing their exposure. The buy wall on the order book at a 3:1 ratio is thick enough, but it looks more like where distribution is happening to offload to buyers, not like an offensive battle flag.
My choice: go short. Around the current price near 1550, short directly, with a stop-loss above 1566. If a true breakout happens, I’ll admit I’m wrong. But based on the current data, this looks like distribution at a new-high area—not a change of hands.
For me to flip to long, I only need one signal: open interest increases and turns upward, the large-account long ratio reverses and starts rising again, and aggressive volume expands and holds steady above 1566. If all three appear together, I’ll cancel the shorts. Until the signal comes, I’ll keep the short positions.
#sndk $SNDK
The futures order book confirms it even more: over the seven hours during which price made a new high, open interest fell 9.49%, total contract value shrank 6.44%, and aggressive trades were also cut by 12.8%. A real breakout is when positions get stacked thicker and thicker. This tape is the opposite: as price rises, the inventory thins.
Also, this isn’t short covering—if shorts were really being squeezed, the funding rate should have turned negative long ago. But across 8 settlement cycles, 7 closed positive. That means the longs holding positions were long while price was rising, steadily reducing their exposure. The buy wall on the order book at a 3:1 ratio is thick enough, but it looks more like where distribution is happening to offload to buyers, not like an offensive battle flag.
My choice: go short. Around the current price near 1550, short directly, with a stop-loss above 1566. If a true breakout happens, I’ll admit I’m wrong. But based on the current data, this looks like distribution at a new-high area—not a change of hands.
For me to flip to long, I only need one signal: open interest increases and turns upward, the large-account long ratio reverses and starts rising again, and aggressive volume expands and holds steady above 1566. If all three appear together, I’ll cancel the shorts. Until the signal comes, I’ll keep the short positions.
#sndk $SNDK