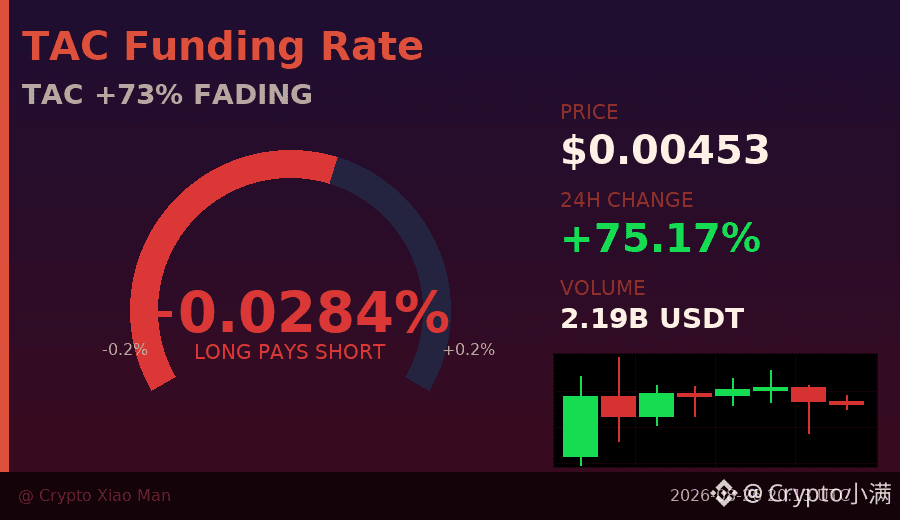
In 24 hours it surged 73%, but now we’re seeing three consecutive bearish candles—what story is TAC telling?
Today it touched a high of 0.00512. From the low point of 0.00242, that’s more than double—over 100% gain.
The first two hourly K-lines had trading volumes nearing 5 billion each. The volume and momentum are huge—typical of a main force pushing higher.
But starting with the third K-line, the volume drops straight to about half. The fourth K-line then cuts another 40%. And the most recent candles have even shrunk to less than 300 million.
Price follows the same pattern: consecutive bearish closes, sliding from around 0.00487 all the way back to about 0.00465.
The volume-price divergence signal is very clear: when price is still elevated but trading volume rapidly fades, it means the buying momentum isn’t being carried forward.
The long/short ratio is currently 51% longs versus 48.75% shorts—basically a near 50/50 split. The market’s disagreement on the next direction is very large.
The funding rate is 0.028%, still in the positive zone. That means the longs are still paying the shorts—implying leveraged long positions are still being held down, with no large-scale exit yet.
In short: this surge is real. But whether it can hold the gains depends on whether volume can re-expand within the current price range.
If volume keeps shrinking and the price breaks below the 0.0044 support, the probability of a short-term pullback will rise significantly.
$TAC #量价背离 #73% signal after the blow-off rally
Click the small card below to quickly check the chart 👇
Today it touched a high of 0.00512. From the low point of 0.00242, that’s more than double—over 100% gain.
The first two hourly K-lines had trading volumes nearing 5 billion each. The volume and momentum are huge—typical of a main force pushing higher.
But starting with the third K-line, the volume drops straight to about half. The fourth K-line then cuts another 40%. And the most recent candles have even shrunk to less than 300 million.
Price follows the same pattern: consecutive bearish closes, sliding from around 0.00487 all the way back to about 0.00465.
The volume-price divergence signal is very clear: when price is still elevated but trading volume rapidly fades, it means the buying momentum isn’t being carried forward.
The long/short ratio is currently 51% longs versus 48.75% shorts—basically a near 50/50 split. The market’s disagreement on the next direction is very large.
The funding rate is 0.028%, still in the positive zone. That means the longs are still paying the shorts—implying leveraged long positions are still being held down, with no large-scale exit yet.
In short: this surge is real. But whether it can hold the gains depends on whether volume can re-expand within the current price range.
If volume keeps shrinking and the price breaks below the 0.0044 support, the probability of a short-term pullback will rise significantly.
$TAC #量价背离 #73% signal after the blow-off rally
Click the small card below to quickly check the chart 👇