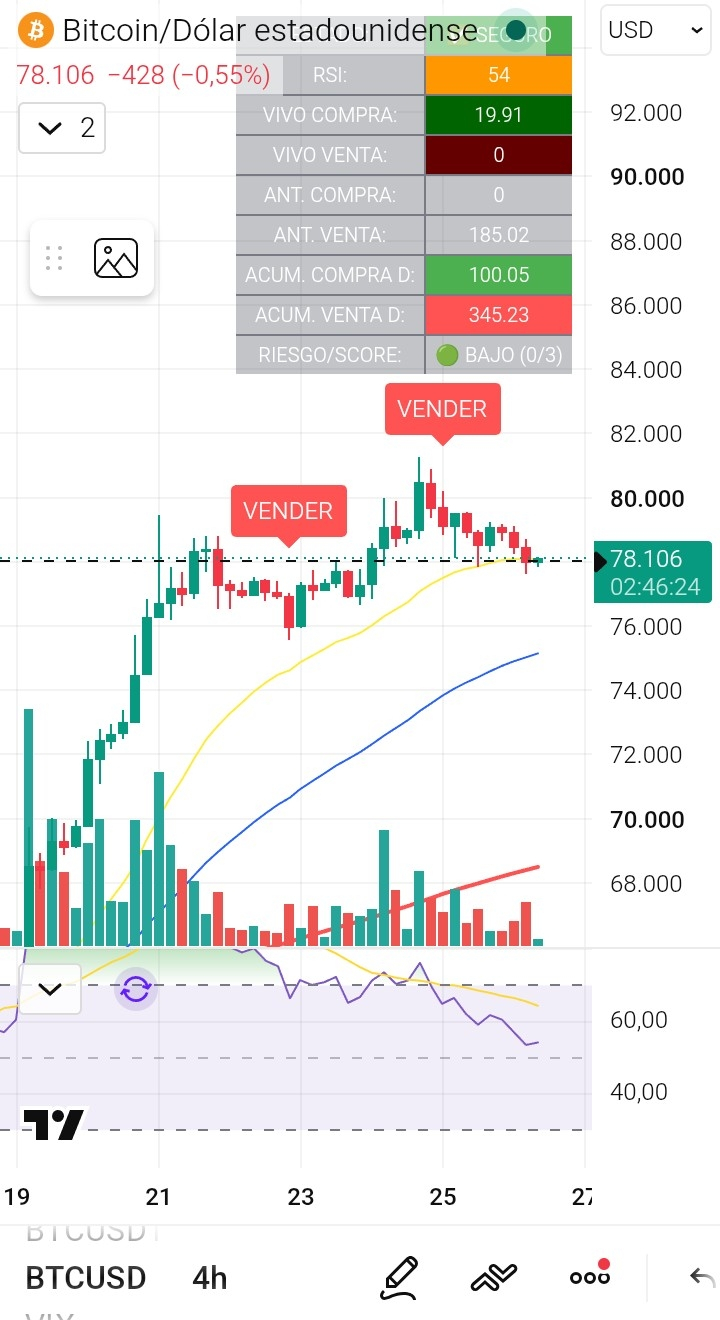
$BTC 🚨 SPECIAL REPORT: THE TRENCH OF $78,000 🚨
Consolidated Analysis & Market Snapshot | Level Hunters of $BTC
📌 DIAGNOSIS IN ONE SENTENCE
Bitcoin is being compressed at $78,000 by a frontal clash of forces: the inflation and high-rate pressure (macro news) is being absorbed by ongoing institutional demand and the safe haven against devaluation (real investment).
🧩 1. WHAT IS HAPPENING UNDER THE STONES
🏦 The Treasury injects indirect liquidity: The decision to double bond buybacks in the U.S. triggers the "debasement trade". Gold and Bitcoin act as a shield against the dollar's loss of purchasing power.
🏛️ Institutional Backing (ETFs): Spot BTC ETFs have accumulated more than $1.9B in weekly flows. Strong hands are buying the $78K floor on the spot.
⚖️ Macro vs. Market: Despite a hot PCE (3.7%), BTC did NOT fall to $74K–$75K. Ignoring bad news reveals underlying demand strength.
📊 2. ORDER FLOW AND DERIVATIVES (Micro vs. Macro)
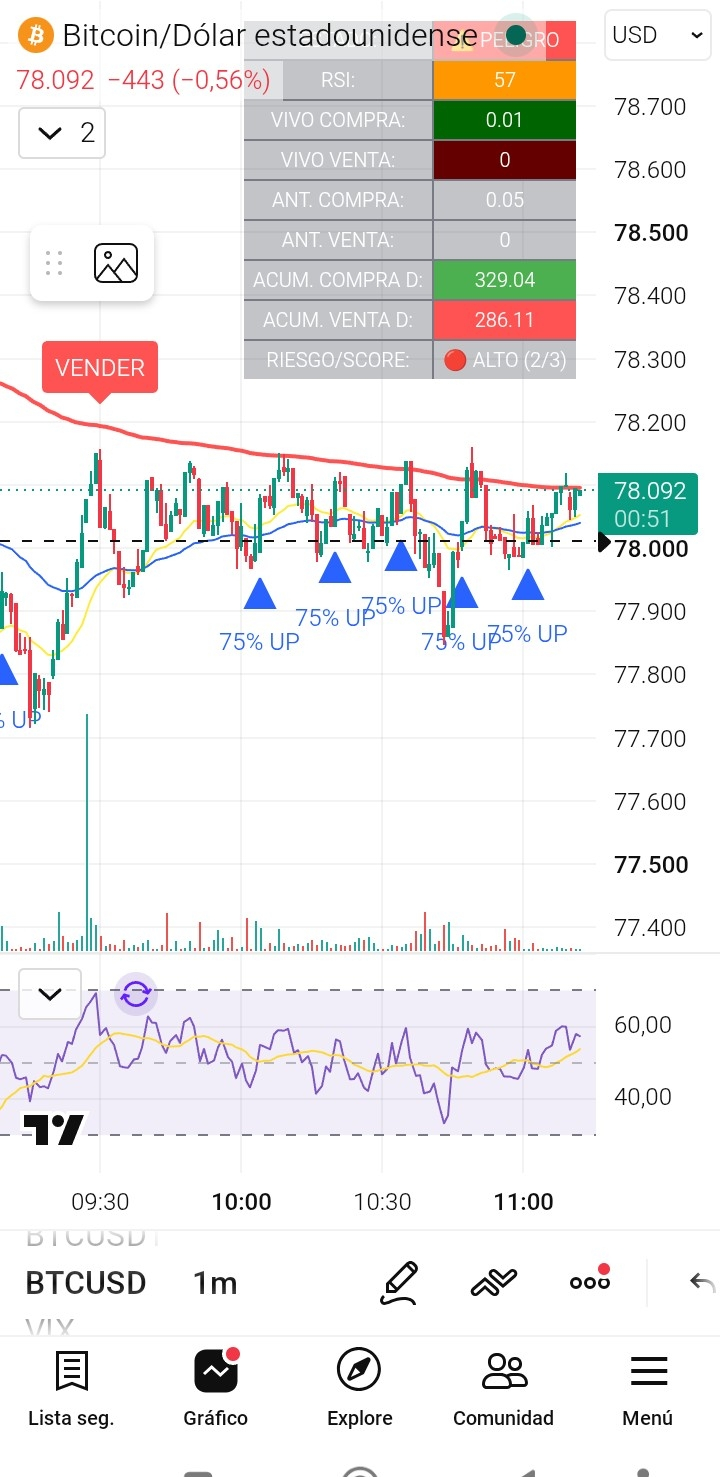
⏱️ 1-Minute Chart:
• Status: 🟢 Buyer (RSI ~57)
• Reading: Net accumulation on micro timeframes (+42.93 BTC in favor).
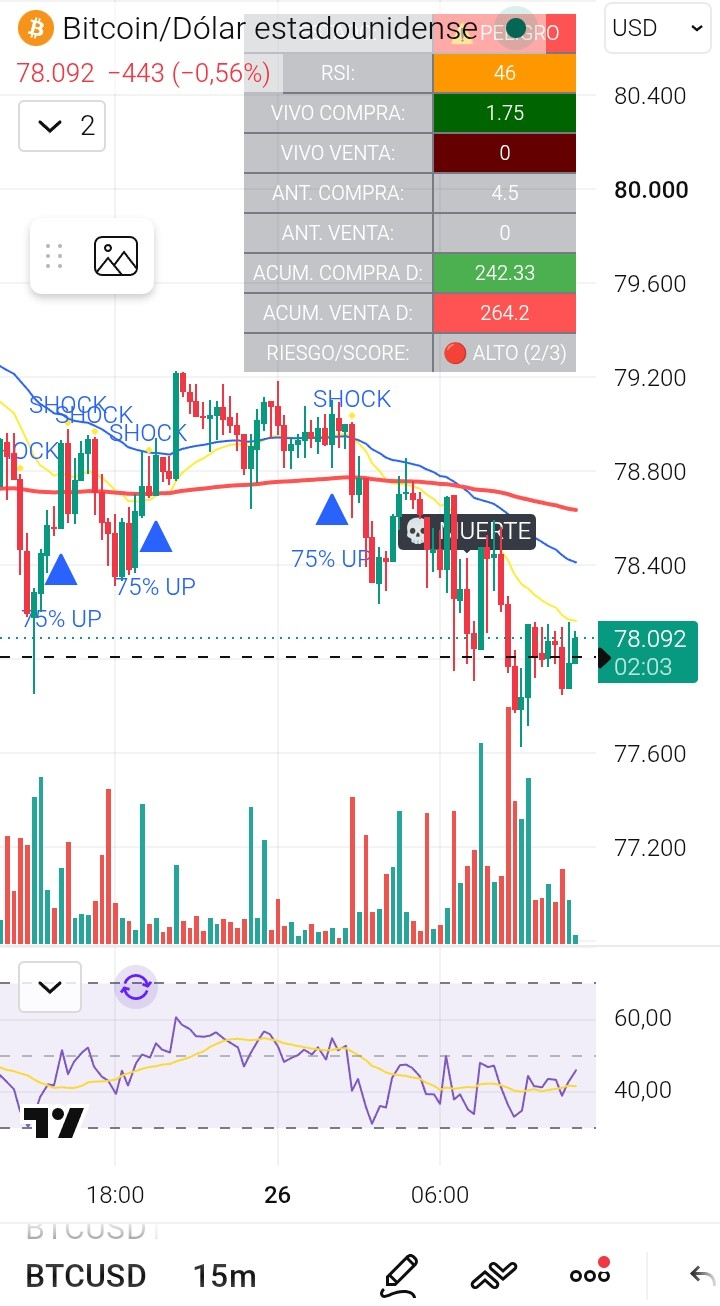
⏱️ 15-Minute Chart:
• Status: 🟡 Neutral (RSI ~46)
• Reading: Slight intraday sell-side (-21.87 BTC) that halts the immediate bullish momentum.
📉 Open Interest (OI) in Derivatives:
• Status: 🟢 Relative Lows
• Reading: Clean market after sweeping $3B of shorts and $270M of longs.
Note: No over-leverage, the price isn’t in a bubble. We’re absorbing sell supply.
🎯 3. TACTICAL LEVEL MAP
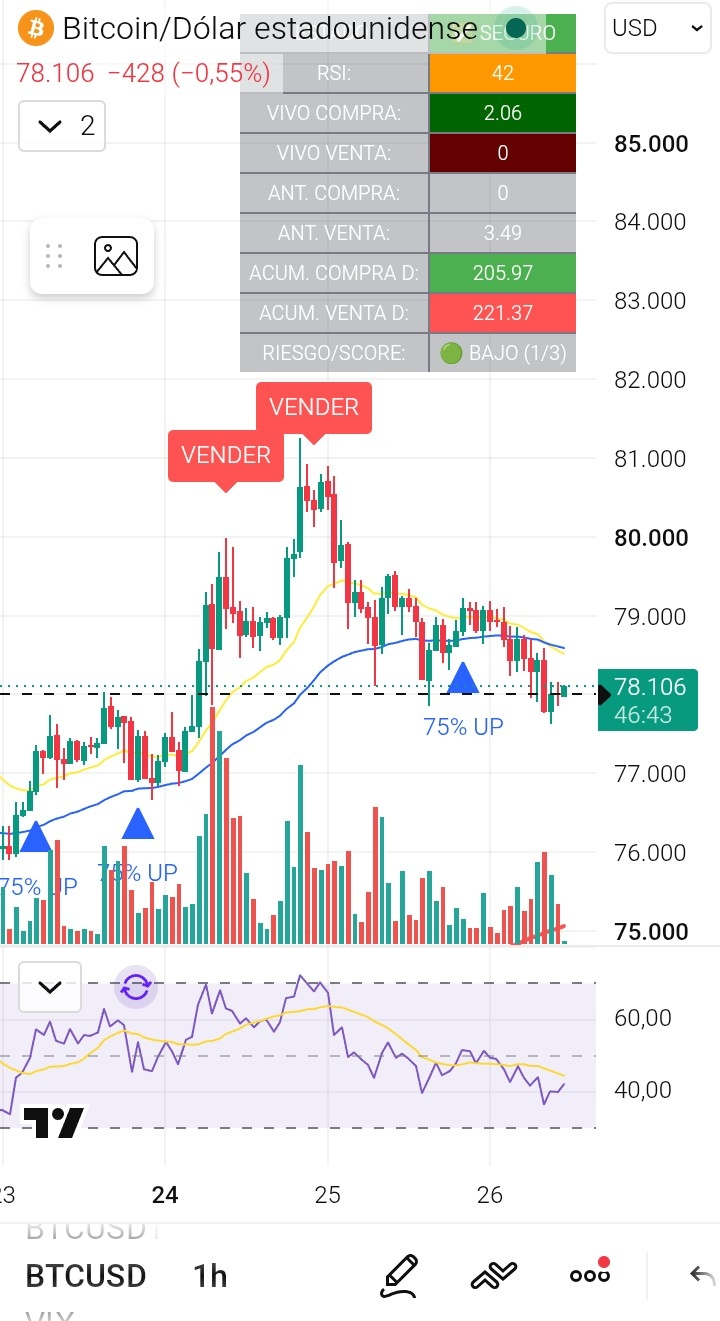
🔴 $81,200 - $81,300 ➔ Recent high (Ceiling to break)
🔴 $80,000 - $81,000 ➔ Psychological resistance (Take-profit zone)
🟠 $79,200 - $79,500 ➔ First confirmation of recovery
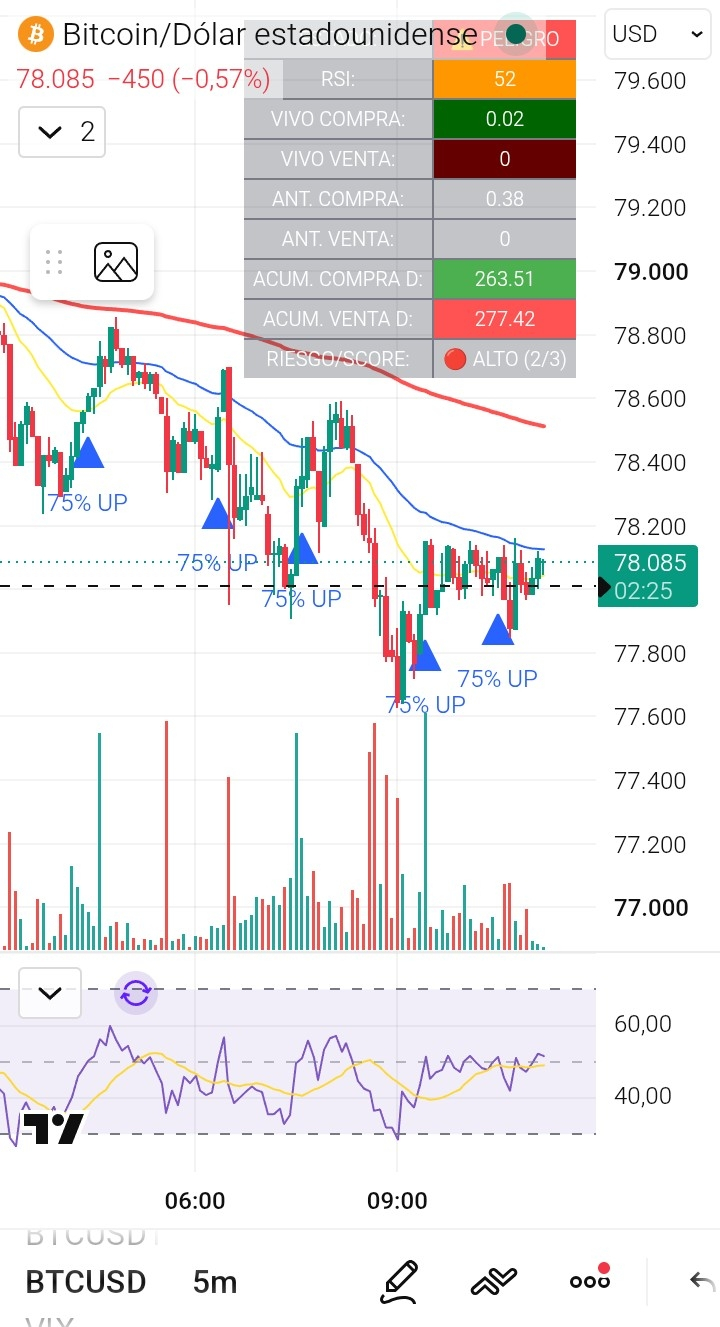
🟡 $78,000 - $78,500 ➔ ⚔️ THE TRENCH (Pivot under defense)
🟠 $76,500 - $77,500 ➔ High-liquidity zone (Possible sweep)
🔴 $71,500 ➔ Structural Macro Level (Life-or-Death Pivot)
⚔️ 4. THREE SCENARIOS FOR THE NEXT FEW HOURS
🟢 Scenario 1: Accumulation and Bullish Breakout (40%)
BTC holds $77,800–$78,500 and RSI on 15m is above 55.
🎯 Targets: $79,200 ➔ $80,000 ➔ $81,250 ➔ $83,000+
🟡 Scenario 2: Liquidity Sweep / Squeeze (35%)
Quick spike toward $76,500–$77,500 to clear late leverage and a fast recovery back to $78K. (Very healthy structure to keep climbing).
🎯 Targets after absorption: $78,000 ➔ $79,500 ➔ $81,000.
🔴 Scenario 3: Bearish Drilling (25%)
Loss of the $77,000 level with sell volume pushing toward $74,000.
🛡️ Key Support: Our macro line at $71,500. As long as it trades above, the overall bullish structure remains intact.
🚦 TRAFFIC LIGHT FOR LEVEL HUNTERS
🟢 Macro / Debasement: BULLISH
🟢 ETF Flows: BULLISH
🟢 Derivatives / OI: HEALTHY (No excess)
🟡 Intraday 15m: CONSOLIDATION
🔴 Immediate Resistance: $79,400 - $80,000
💬 DEBATE FOR THE COMMUNITY
With inflationary PCE pressuring, ETFs buying strongly, and price frozen at $78,000:
Do you think we’ll see the tactical sweep toward $76.5K–$77.5K to build momentum, or do we go directly to break $80,000? How are you positioning your stops in this battle zone?