Post


0mega
·
--
What is the RSI? And why is it important in the trading world.
The RSI (Relative Strength Index) is a technical indicator in the form of an oscillator that measures the speed and change of prices to determine whether an asset has bullish or bearish strength.
...🎁🎁🎁🫶🏻 Follow me and share 🫶🏻🎁🎁🎁...
It was created by J. Welles Wilder in 1978. It is represented on a graphical scale that always ranges from 0 to 100.
How does the RSI scale work?
Level 50: This is the neutral point. If the indicator is above 50, it shows bullish strength. If it is below 50, it indicates bearish strength.
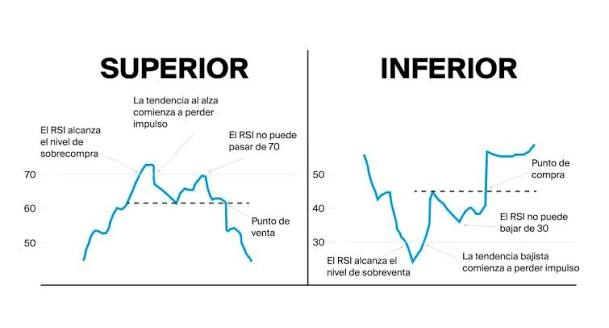
Overbought (above 70): It means the price has risen very quickly. The asset may be expensive and there is a possibility that the price will drop soon.
Oversold (below 30): It means the price has fallen with a lot of force. The asset may be cheap and could start an upward rebound.
"Fun facts"
Divergences: They occur when price and the RSI move in opposite directions. For example, if the price rises to a new high but the RSI falls, it warns that the momentum is fading and the price could drop.
Trend confirmation: In a strong uptrend, the RSI usually stays between 40 and 80 instead of falling to 30.
The RSI (Relative Strength Index) is a technical indicator in the form of an oscillator that measures the speed and change of prices to determine whether an asset has bullish or bearish strength.
...🎁🎁🎁🫶🏻 Follow me and share 🫶🏻🎁🎁🎁...
It was created by J. Welles Wilder in 1978. It is represented on a graphical scale that always ranges from 0 to 100.
How does the RSI scale work?
Level 50: This is the neutral point. If the indicator is above 50, it shows bullish strength. If it is below 50, it indicates bearish strength.
Overbought (above 70): It means the price has risen very quickly. The asset may be expensive and there is a possibility that the price will drop soon.
Oversold (below 30): It means the price has fallen with a lot of force. The asset may be cheap and could start an upward rebound.
"Fun facts"
Divergences: They occur when price and the RSI move in opposite directions. For example, if the price rises to a new high but the RSI falls, it warns that the momentum is fading and the price could drop.
Trend confirmation: In a strong uptrend, the RSI usually stays between 40 and 80 instead of falling to 30.