Solana just gave us one of those scares that make you spill your coffee, breaking through the $125 barrier to test the $104 zone, but beware, those who know how to read the charts are seeing more than just simple red candles. 📉🔥
The fall was not a coincidence. SOL could not maintain the support it had since January and, as it slipped, it took down its 50-day moving average (which was at $128). This triggered alarms for sellers, pushing the price down sharply. But here is where things get interesting for us: the RSI (which measures how "burned out" the market is) dropped to 30, indicating that Solana is entering oversold territory. In other words, they got carried away selling. 📉🤔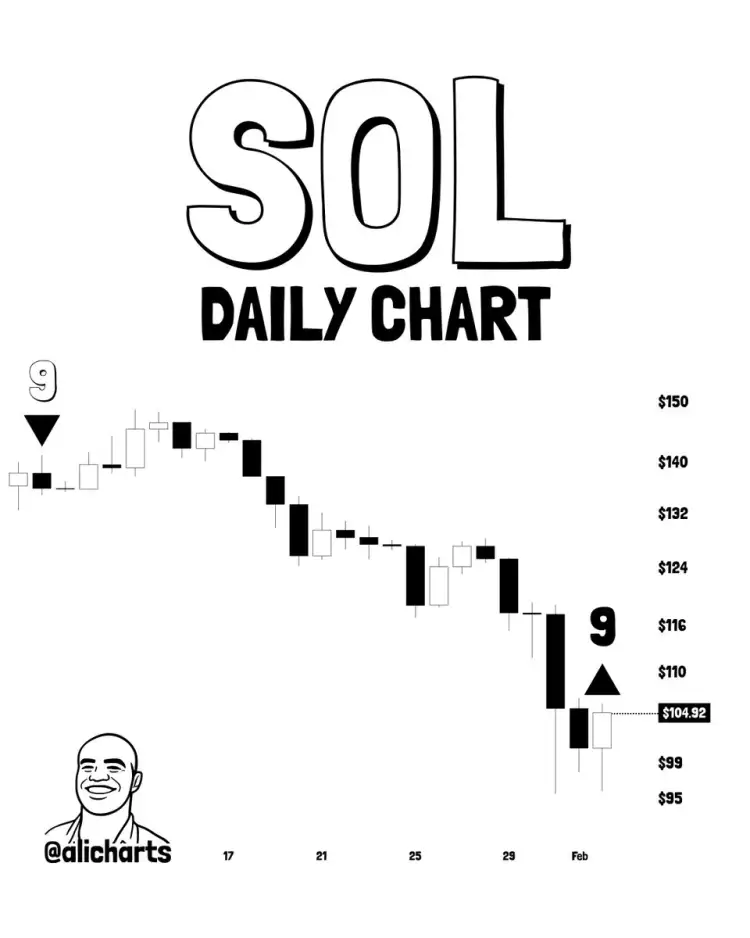
The best comes from analysts who do not get carried away by panic. Ali Charts dropped a bomb: the TD Sequential indicator, which pinpointed Solana's peak on January 9, has just signaled a buy on the daily chart. Additionally, the legendary Trader Tardigrade says that SOL is touching the bottom of a weekly descending channel. Historically, every time Solana reaches that "bottom," it skyrockets. We're talking about levels that have previously driven massive rebounds! 🚀💎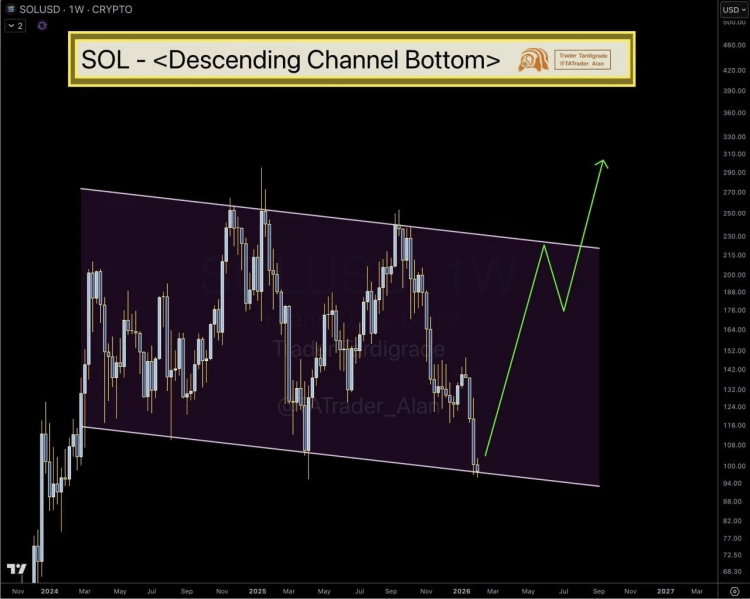
And to top off the confidence cake, while the price suffered, the Solana network was making history. Nansen just launched its NX8 index (which tracks the 8 most important blockchains like BTC, ETH, and SOL) and chose Solana as its base home for the launch. This is not only due to low fees but also because the total value locked (TVL) in Solana has just hit an all-time high of 73.4 million SOL. There is more money trusting the ecosystem than ever before! 🏦🌐
Although the drop to $104 hurt, the technical fundamentals and the actual use of the network suggest that this could be a necessary "reset" before looking for higher targets, with some analysts even glancing toward $215 or $260 if we recover $120 soon. 🎯💸
Do you think this drop to $104 is the last opportunity to get on the boat before the next takeoff, or do we still need to see a little more blood on the charts?
