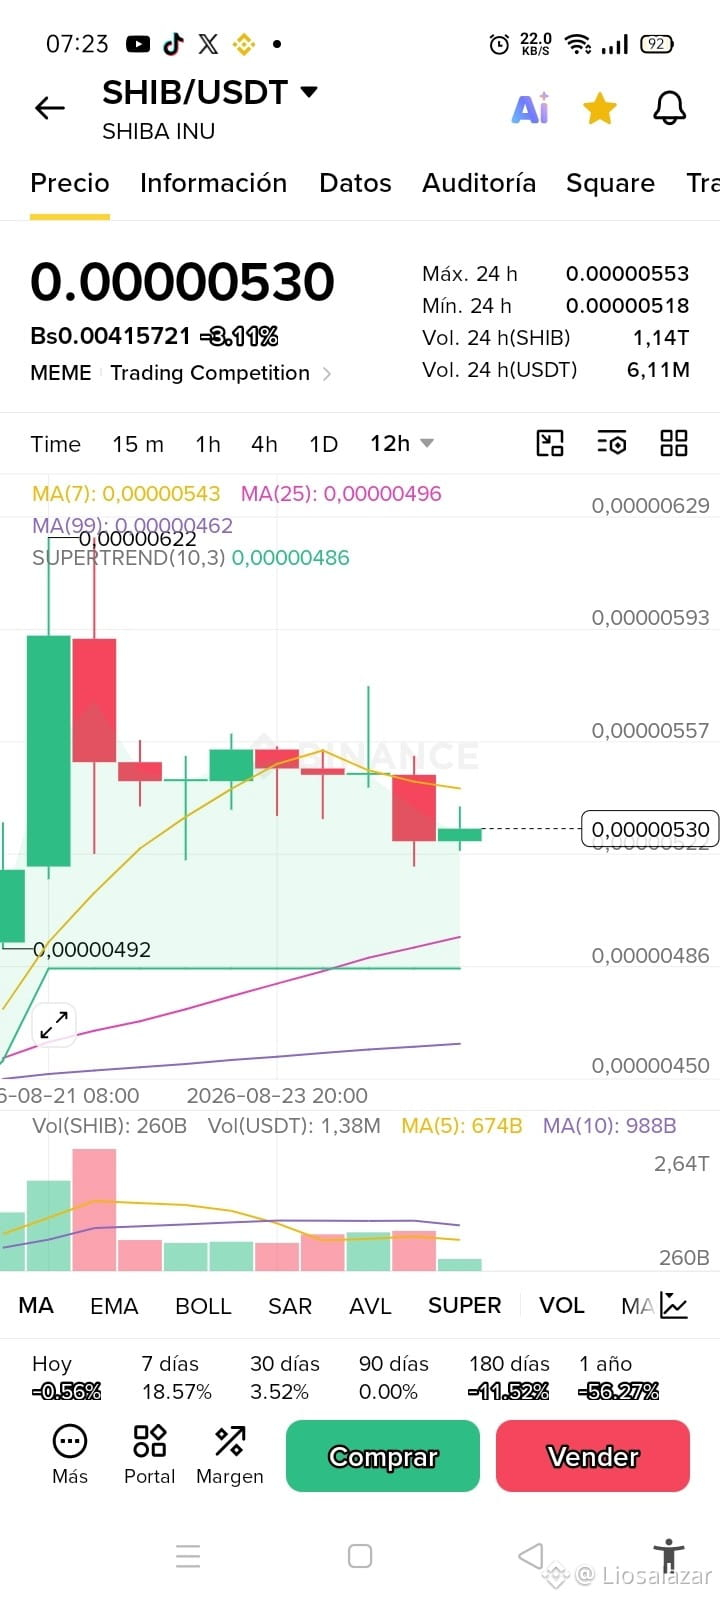
Technical analysis: SHIB/USDT (Shiba Inu) on the 12-hour timeframe
Analysis of SHIB/USDT asset behavior, which is going through a consolidation phase in a range after giving up its short-term fast moving average, trying to stabilize over its main dynamic supports.
Key market data:
Current price: 0.00000530 USDT (-3.11%).
24h high: 0.00000553 USDT.
24h low: 0.00000518 USDT.
24h volume (USDT): 6.11M USDT.
Technical levels and key indicators (12h):
Moving Averages:
MA(7): 0.00000543 USDT (dynamic and immediate short-term resistance).
MA(25): 0.00000496 USDT (main medium-term technical support).
MA(99): 0.00000462 USDT (long-term structural base).
SuperTrend (10,3): Remains bullish, setting its defensive level at 0.00000486 USDT.
Reference points:
Main resistance: Roof recorded at 0.00000622 USDT.
Origin support: Zone of the lows at 0.00000492 USDT.
Outlook:
SHIB maintains its overall bullish trend supported above the MA(25) and the MA(99). However, after losing the initial momentum toward the 0.00000622 USDT ceiling, the asset has entered a sideways range suppressed by the MA(7) at 0.00000543 USDT.
The recent green candle is trying to slow bearish pressure after bouncing from the 24h low ($0.00000518). To regain bullish strength and seek a move toward the recent high ($0.00000553), demand needs to consolidate closes above the MA(7) ($0.00000543). If rejection persists in this area, the price would extend consolidation toward its defensive supports at the MA(25) ($0.00000496) and the SuperTrend ($0.00000486).
(Disclaimer: Structured informational content for Binance Square. This does not constitute financial or investment advice. Always do your own research).
#Crypto #SHIB #ShibaInu #BinanceSquare #TechnicalAnalysis
Analysis of SHIB/USDT asset behavior, which is going through a consolidation phase in a range after giving up its short-term fast moving average, trying to stabilize over its main dynamic supports.
Key market data:
Current price: 0.00000530 USDT (-3.11%).
24h high: 0.00000553 USDT.
24h low: 0.00000518 USDT.
24h volume (USDT): 6.11M USDT.
Technical levels and key indicators (12h):
Moving Averages:
MA(7): 0.00000543 USDT (dynamic and immediate short-term resistance).
MA(25): 0.00000496 USDT (main medium-term technical support).
MA(99): 0.00000462 USDT (long-term structural base).
SuperTrend (10,3): Remains bullish, setting its defensive level at 0.00000486 USDT.
Reference points:
Main resistance: Roof recorded at 0.00000622 USDT.
Origin support: Zone of the lows at 0.00000492 USDT.
Outlook:
SHIB maintains its overall bullish trend supported above the MA(25) and the MA(99). However, after losing the initial momentum toward the 0.00000622 USDT ceiling, the asset has entered a sideways range suppressed by the MA(7) at 0.00000543 USDT.
The recent green candle is trying to slow bearish pressure after bouncing from the 24h low ($0.00000518). To regain bullish strength and seek a move toward the recent high ($0.00000553), demand needs to consolidate closes above the MA(7) ($0.00000543). If rejection persists in this area, the price would extend consolidation toward its defensive supports at the MA(25) ($0.00000496) and the SuperTrend ($0.00000486).
(Disclaimer: Structured informational content for Binance Square. This does not constitute financial or investment advice. Always do your own research).
#Crypto #SHIB #ShibaInu #BinanceSquare #TechnicalAnalysis