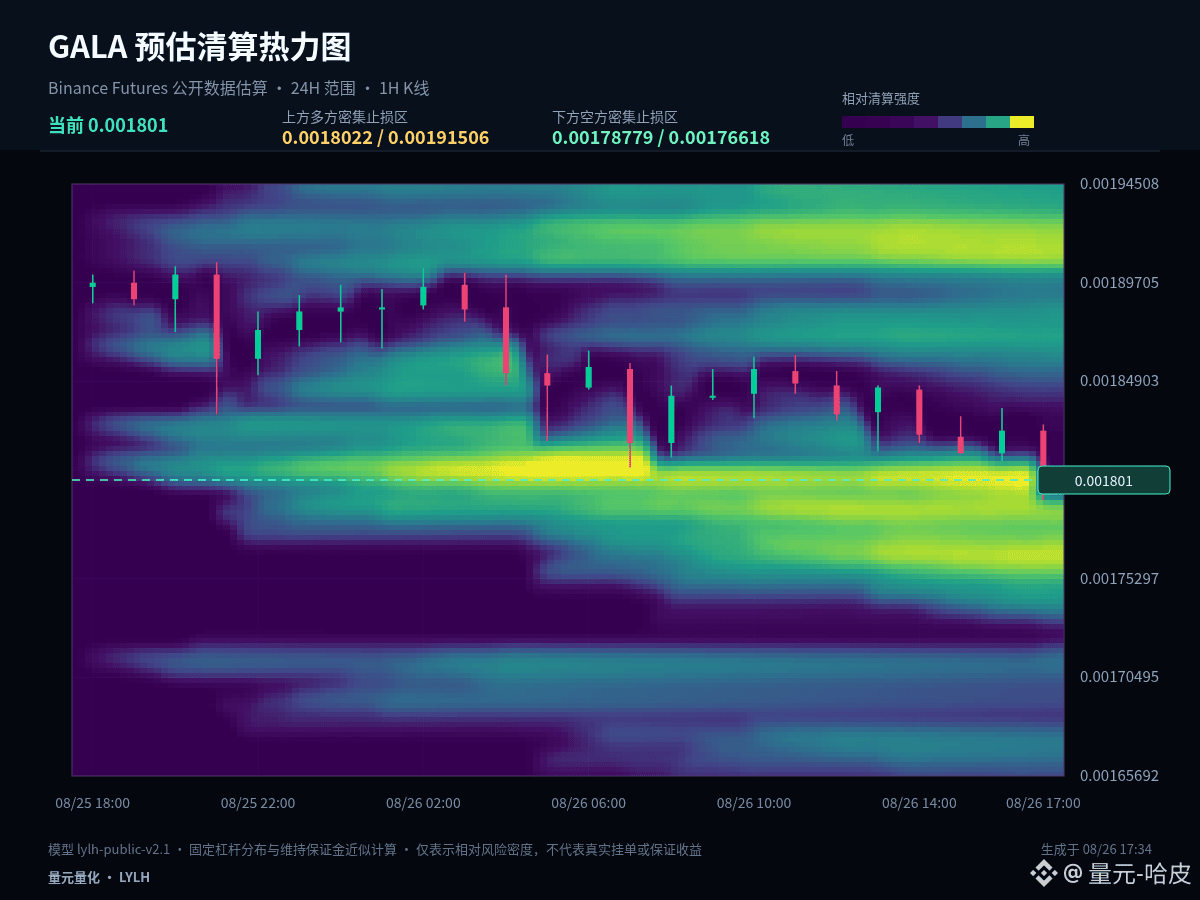
$GALA #GALA Current price 0.001803. This time I’m not just looking at the up/down percentage move—I put the 1-hour structure together with the estimated liquidation distribution to see which side the price is more likely to seek liquidity next.
The current price is near the lower bound of the last 24 hours’ volatility: 1 hour -1.21%, 24 hours -5.75%. The key in low-level analysis is not trying to catch the bottom early; it’s watching whether the market can quickly reclaim after a breakdown. Being able to reclaim means the selling pressure has been absorbed; lingering below the lower bound suggests the weakness hasn’t ended yet.
Based on the estimated liquidation heatmap, 0.0018022 and 0.00178779 are the liquidity zones on either side of the current price that are worth tracking more closely. The market may first seek out the dense成交 zone—but touching it is only the first step. A rapid break-through indicates momentum is in control; if it gets hit and then quickly reclaims, it’s more like a release of liquidity.
In terms of price structure, 0.001849 is the intraday midline. The usual resistance and support are 0.001906 and 0.001792, respectively. The heatmap price levels are used to watch for potential liquidity, while the K-line key levels are used to confirm the structure. When both align, the reference value is higher; when they don’t, rely on the market’s actual reaction.
For the next path, handle it in three ways: if it effectively holds above 0.001906, wait for a pullback that doesn’t break and then reassess for continuation; if it breaks down below 0.001792, prioritize risk control and wait for a new support; if it continues to range around 0.001849, treat it as rotation within a range and don’t chase direction repeatedly in the middle.
The focus of the contract is not to predict every single K-line. It’s to ensure there’s a basis for entry, scaling out, and exits. Do less until there’s confirmation; when a key level fails, redo the plan. Control risk on a per-trade basis first, then talk about potential upside/downside.
The market will ultimately validate the thesis with price action. Do you think the most critical right now is a breakout of 0.001906, or the defense of 0.001792? Let’s track the next results together.
#SolanaRWAHoldersTop300000
The current price is near the lower bound of the last 24 hours’ volatility: 1 hour -1.21%, 24 hours -5.75%. The key in low-level analysis is not trying to catch the bottom early; it’s watching whether the market can quickly reclaim after a breakdown. Being able to reclaim means the selling pressure has been absorbed; lingering below the lower bound suggests the weakness hasn’t ended yet.
Based on the estimated liquidation heatmap, 0.0018022 and 0.00178779 are the liquidity zones on either side of the current price that are worth tracking more closely. The market may first seek out the dense成交 zone—but touching it is only the first step. A rapid break-through indicates momentum is in control; if it gets hit and then quickly reclaims, it’s more like a release of liquidity.
In terms of price structure, 0.001849 is the intraday midline. The usual resistance and support are 0.001906 and 0.001792, respectively. The heatmap price levels are used to watch for potential liquidity, while the K-line key levels are used to confirm the structure. When both align, the reference value is higher; when they don’t, rely on the market’s actual reaction.
For the next path, handle it in three ways: if it effectively holds above 0.001906, wait for a pullback that doesn’t break and then reassess for continuation; if it breaks down below 0.001792, prioritize risk control and wait for a new support; if it continues to range around 0.001849, treat it as rotation within a range and don’t chase direction repeatedly in the middle.
The focus of the contract is not to predict every single K-line. It’s to ensure there’s a basis for entry, scaling out, and exits. Do less until there’s confirmation; when a key level fails, redo the plan. Control risk on a per-trade basis first, then talk about potential upside/downside.
The market will ultimately validate the thesis with price action. Do you think the most critical right now is a breakout of 0.001906, or the defense of 0.001792? Let’s track the next results together.
#SolanaRWAHoldersTop300000