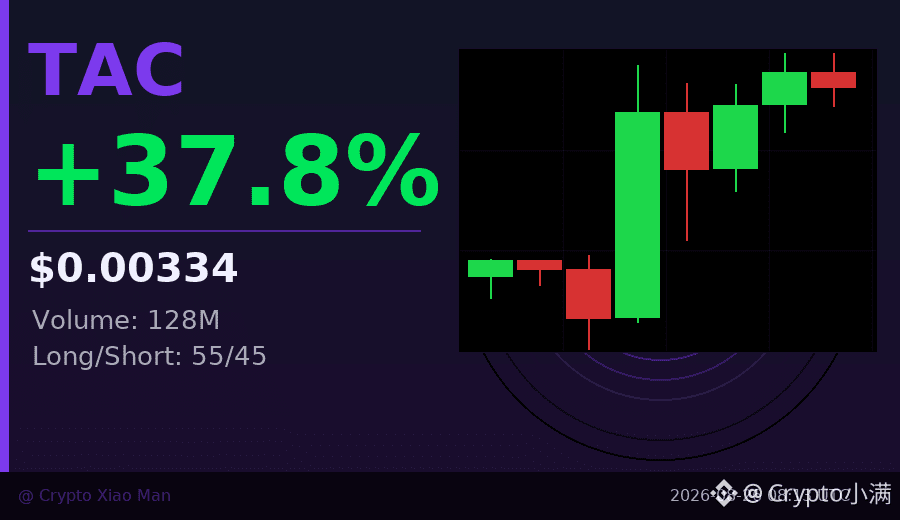
One candlestick says everything.
Candle #4 of $TAC : opened at 0.00253, surged to a high of 0.00340, dipped to a low of 0.00251, and closed at 0.00323—trading volume exploded to 2.9 billion units, more than twice that of the previous two candles.
This pattern is a classic “main force volume surge for accumulation”: the price is smashed down to an extreme low point, then quickly pulled back by large orders, closing and holding at a relatively high level. Most retail investors were selling at a loss at that moment—yet they ended up being the ones left holding the bag.
The 24-hour gain is already 37.2%. From the low at 0.00224, the maximum upside exceeds 53%.
Right now the long/short ratio is still tilted bullish: longs at 55.3% and shorts at 44.7%. The funding rate is 0.012%—not extreme, but it also shows that longs are paying a cost to maintain their positions.
What to watch today: whether the volume can keep up. The most recent candle’s trading volume has started to ease (down to 5.1 billion). If the next few candles maintain high volume, it indicates sustained buy pressure. If volume shrinks rapidly, the area around 0.00344 overhead is likely resistance, and the market may consolidate to digest gains in the short term.
After a big rally, the easiest mistake to make is chasing the price. Going in after it’s already up 37% means the risk-to-opportunity ratio no longer favors you—understanding matters more than rushing in.
$TAC #暴量拉升 #37%
Click the small card below to quickly check the行情👇
Candle #4 of $TAC : opened at 0.00253, surged to a high of 0.00340, dipped to a low of 0.00251, and closed at 0.00323—trading volume exploded to 2.9 billion units, more than twice that of the previous two candles.
This pattern is a classic “main force volume surge for accumulation”: the price is smashed down to an extreme low point, then quickly pulled back by large orders, closing and holding at a relatively high level. Most retail investors were selling at a loss at that moment—yet they ended up being the ones left holding the bag.
The 24-hour gain is already 37.2%. From the low at 0.00224, the maximum upside exceeds 53%.
Right now the long/short ratio is still tilted bullish: longs at 55.3% and shorts at 44.7%. The funding rate is 0.012%—not extreme, but it also shows that longs are paying a cost to maintain their positions.
What to watch today: whether the volume can keep up. The most recent candle’s trading volume has started to ease (down to 5.1 billion). If the next few candles maintain high volume, it indicates sustained buy pressure. If volume shrinks rapidly, the area around 0.00344 overhead is likely resistance, and the market may consolidate to digest gains in the short term.
After a big rally, the easiest mistake to make is chasing the price. Going in after it’s already up 37% means the risk-to-opportunity ratio no longer favors you—understanding matters more than rushing in.
$TAC #暴量拉升 #37%
Click the small card below to quickly check the行情👇