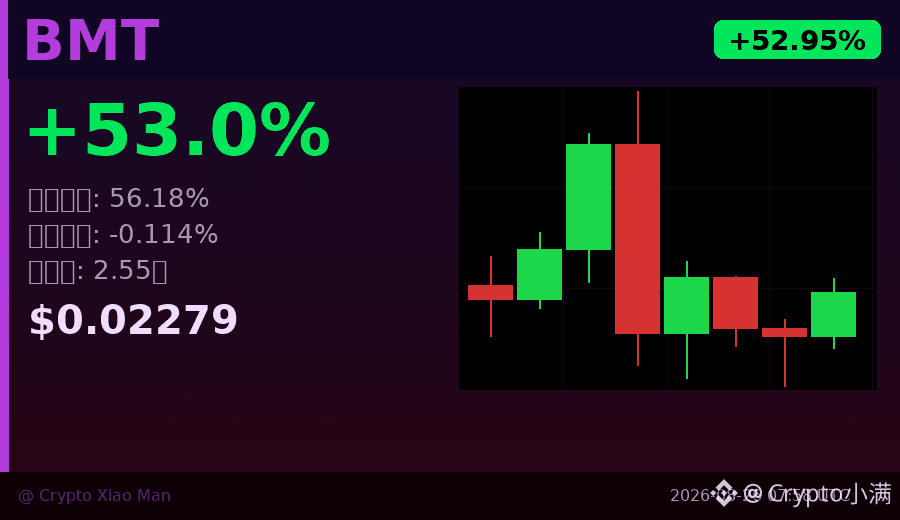
A 53% surge, yet longs only account for 43%—when you put these data together, it’s a bit abnormal.
Today, <c-1/> the highest point for $BMT reached 0.02782. From the low of 0.0149, it’s up nearly 87%, with very strong momentum. But now the long/short ratio is 43:56, with shorts actually in the majority. Meanwhile, the funding rate is still negative (-0.114%).
What does a negative funding rate mean? Shorts are paying longs. That is to say, even though there are more shorts, they’re effectively "losing money while holding on." In this kind of structure, once the price rises even slightly, it’s easy to trigger short stop-losses, which can then push the price further up.
Looking at the candlesticks, after a recent big bullish candle, the trading volume has dropped from a peak of 1.7 billion back to the 400–500 million range, and the price has also pulled back from the high to around 0.0228. It hasn’t collapsed—more like digesting the previous rally and waiting for a new direction.
Two signals worth watching: if the funding rate turns positive, it means longs start paying, and the enthusiasm may be close to topping out; if trading volume expands again and breaks above 0.026, the prior high could be tested once more.
In terms of trading, this kind of high-volatility coin is easy to get carried away by emotion—greedy when it’s up, panicky when it’s down. Seeing the structure matters more than chasing the price.
$BMT #空头多却涨 #Funding Rate -0.114%
Click the small card below to quickly check the market 👇
Today, <c-1/> the highest point for $BMT reached 0.02782. From the low of 0.0149, it’s up nearly 87%, with very strong momentum. But now the long/short ratio is 43:56, with shorts actually in the majority. Meanwhile, the funding rate is still negative (-0.114%).
What does a negative funding rate mean? Shorts are paying longs. That is to say, even though there are more shorts, they’re effectively "losing money while holding on." In this kind of structure, once the price rises even slightly, it’s easy to trigger short stop-losses, which can then push the price further up.
Looking at the candlesticks, after a recent big bullish candle, the trading volume has dropped from a peak of 1.7 billion back to the 400–500 million range, and the price has also pulled back from the high to around 0.0228. It hasn’t collapsed—more like digesting the previous rally and waiting for a new direction.
Two signals worth watching: if the funding rate turns positive, it means longs start paying, and the enthusiasm may be close to topping out; if trading volume expands again and breaks above 0.026, the prior high could be tested once more.
In terms of trading, this kind of high-volatility coin is easy to get carried away by emotion—greedy when it’s up, panicky when it’s down. Seeing the structure matters more than chasing the price.
$BMT #空头多却涨 #Funding Rate -0.114%
Click the small card below to quickly check the market 👇