
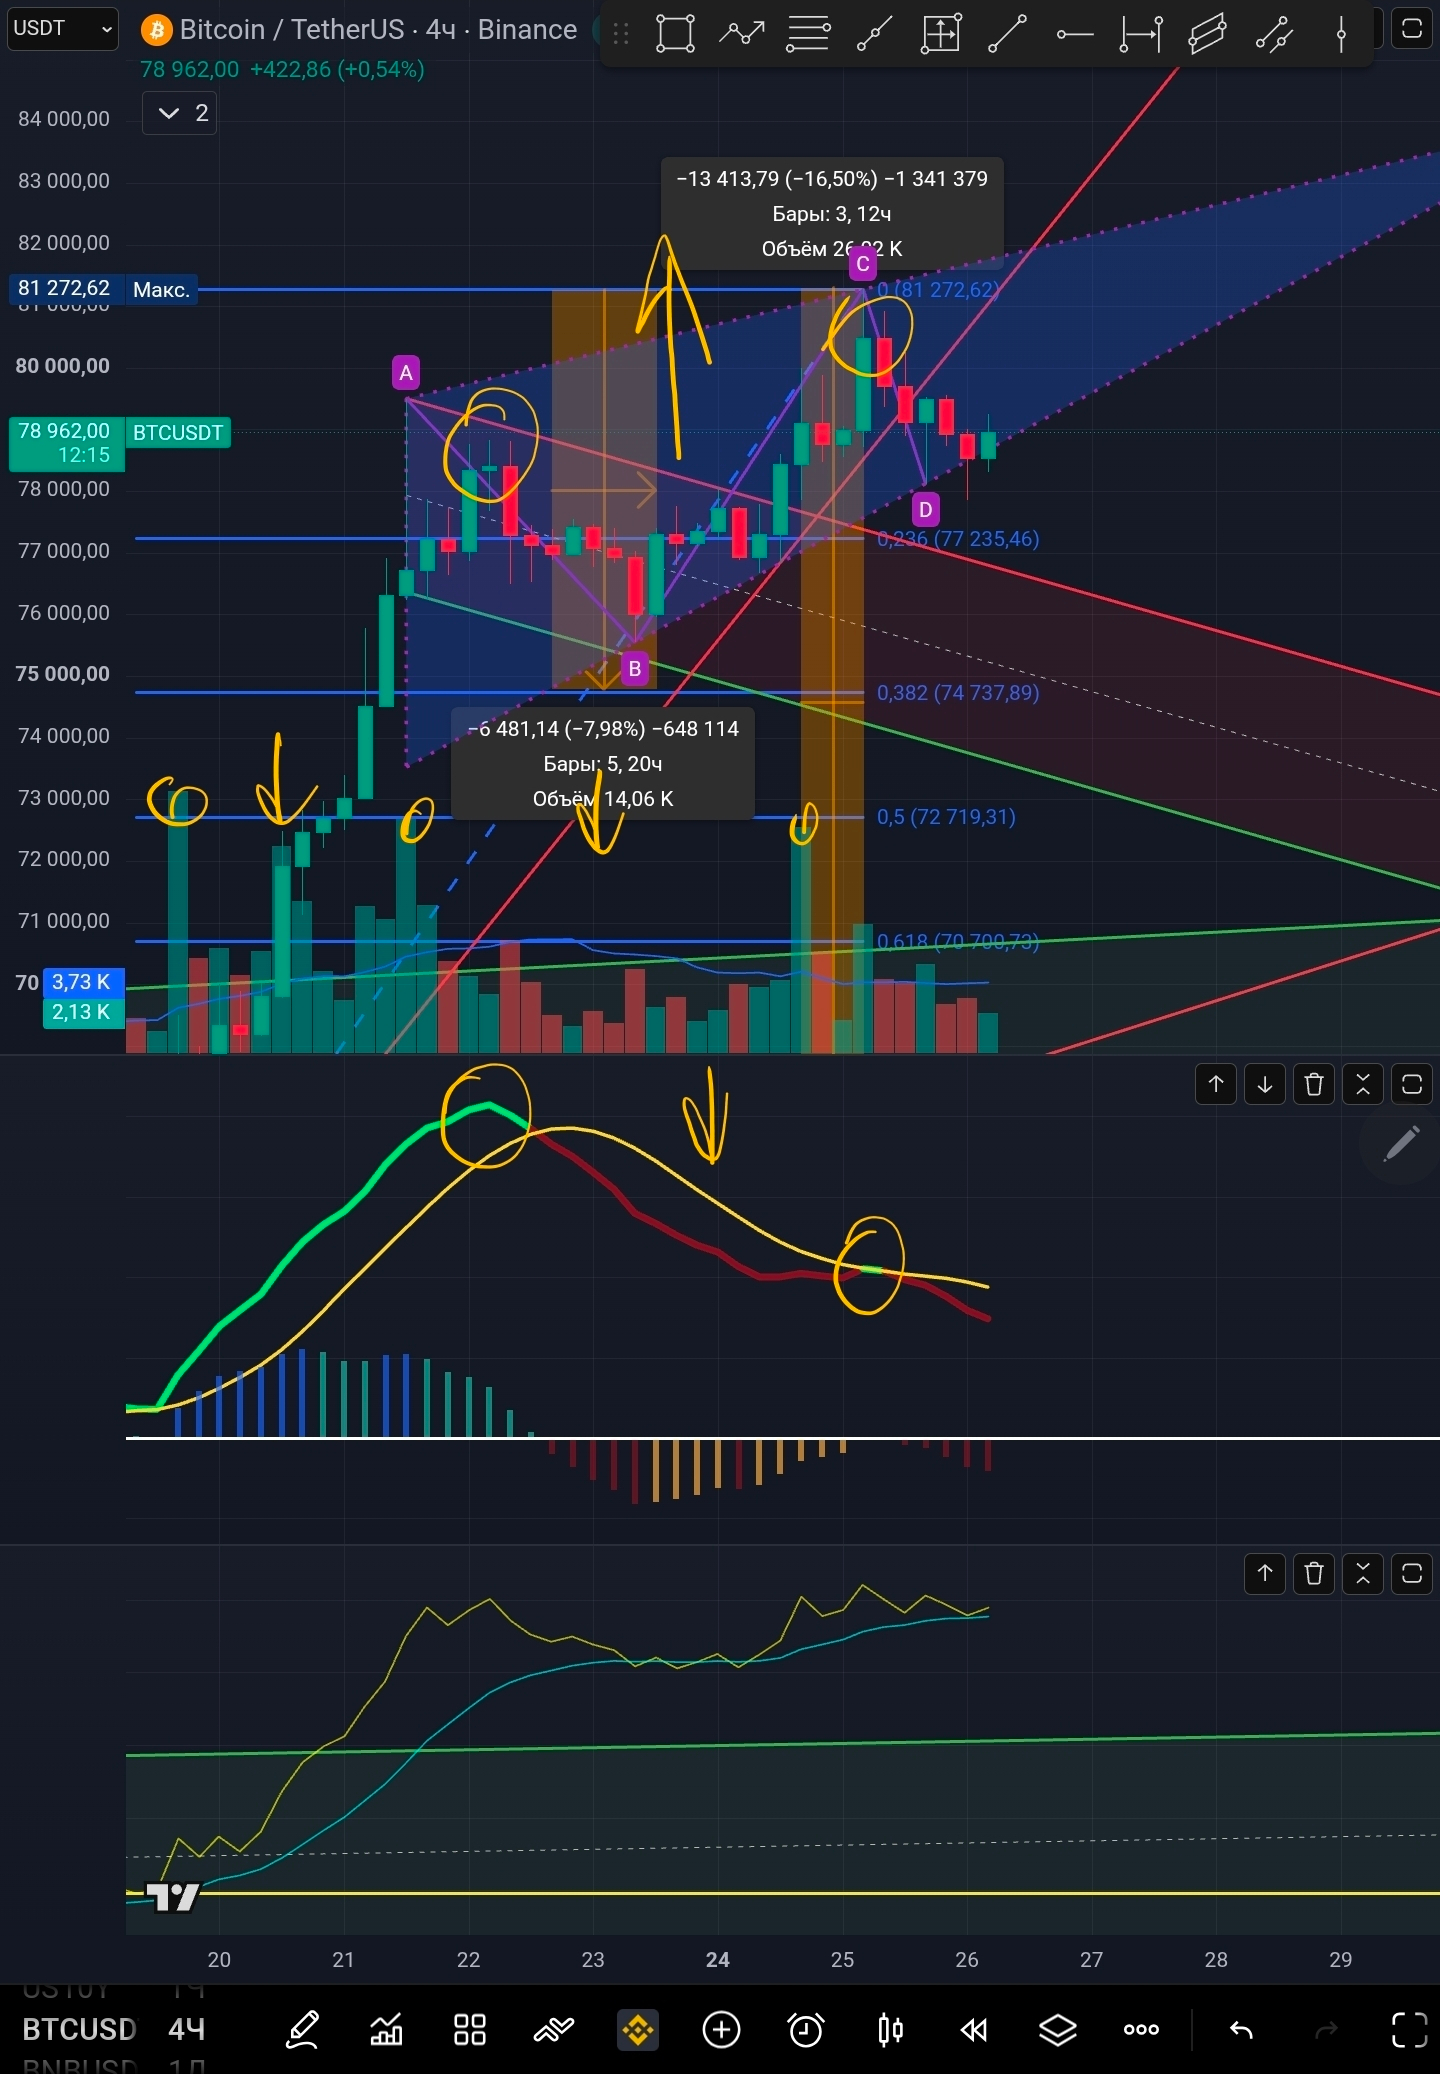
📍Good morning dear friends! Let’s start the analysis right away and begin with 4-hour candles. On higher timeframes, nothing has changed yet; for a review of the higher timeframes, please see the previous episodes.
📍MACD indicates a bearish divergence — a negative signal. A drop in volume with new highs, a negative signal. The volume balance indicator follows the price, a neutral signal. The overall indicator sentiment is negative. On the chart, a pattern called an ascending triangle can be seen; with a probability of 70–80%, it is a continuation of the bearish trend or a break of the bullish trend. The mechanics behind this pattern mean that those who entered earlier are not adding more, and the upward price movement lacks power because there are few new buyers. The halt becomes even more pronounced when those who entered earlier begin to doubt and take profits.
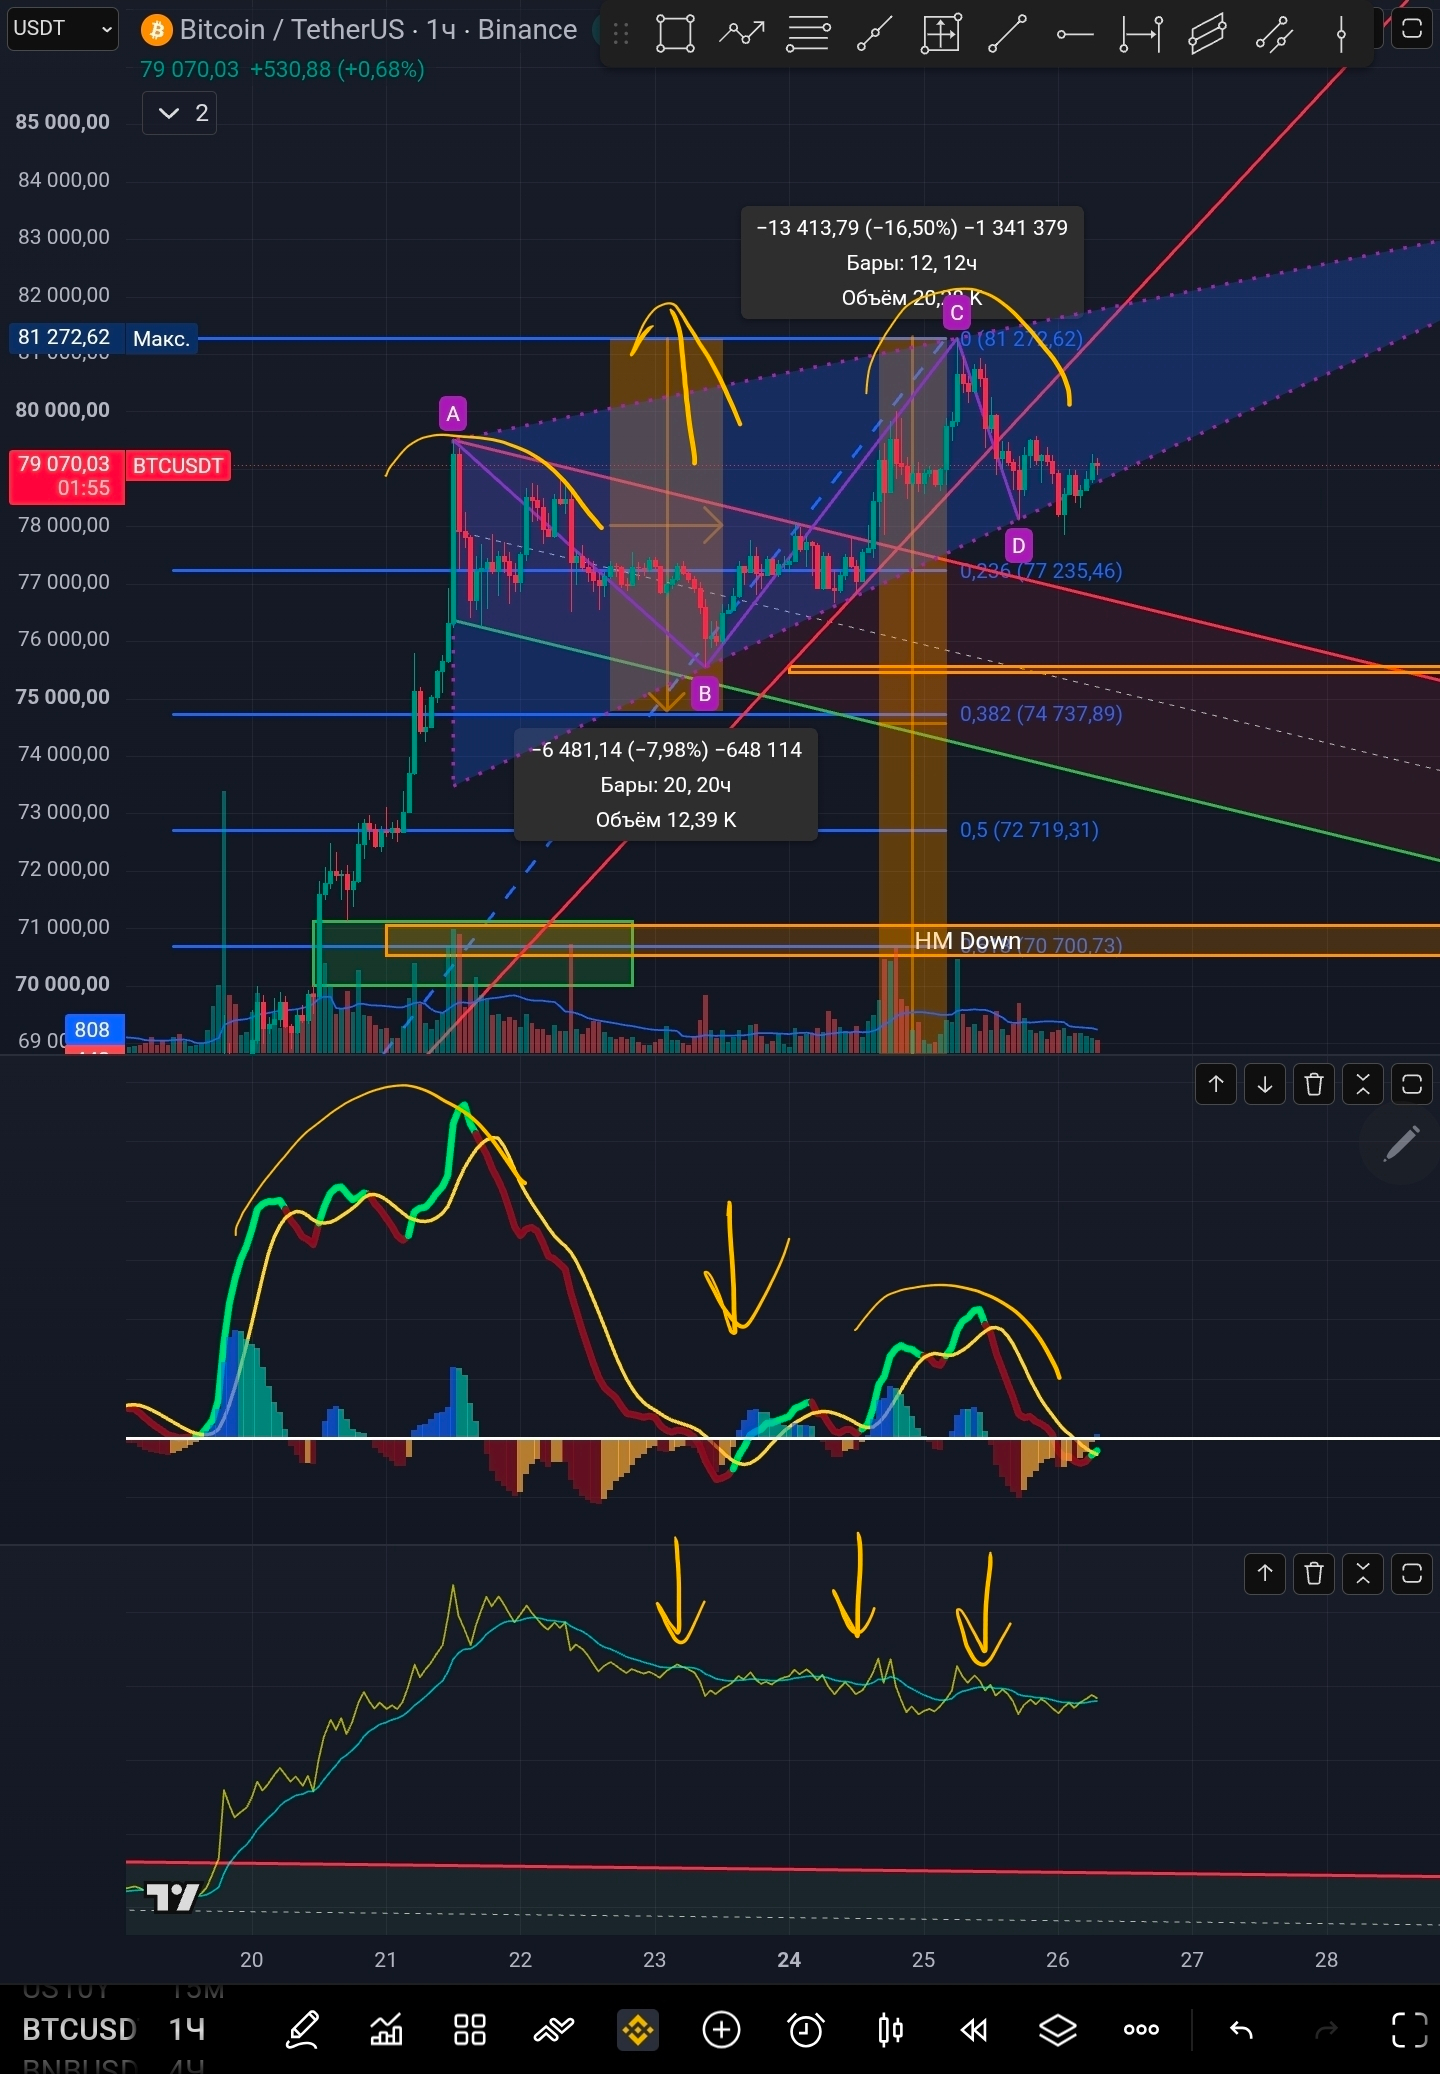
📍 On the hourly candles, there are bearish divergences on both indicators—a confidently negative signal.
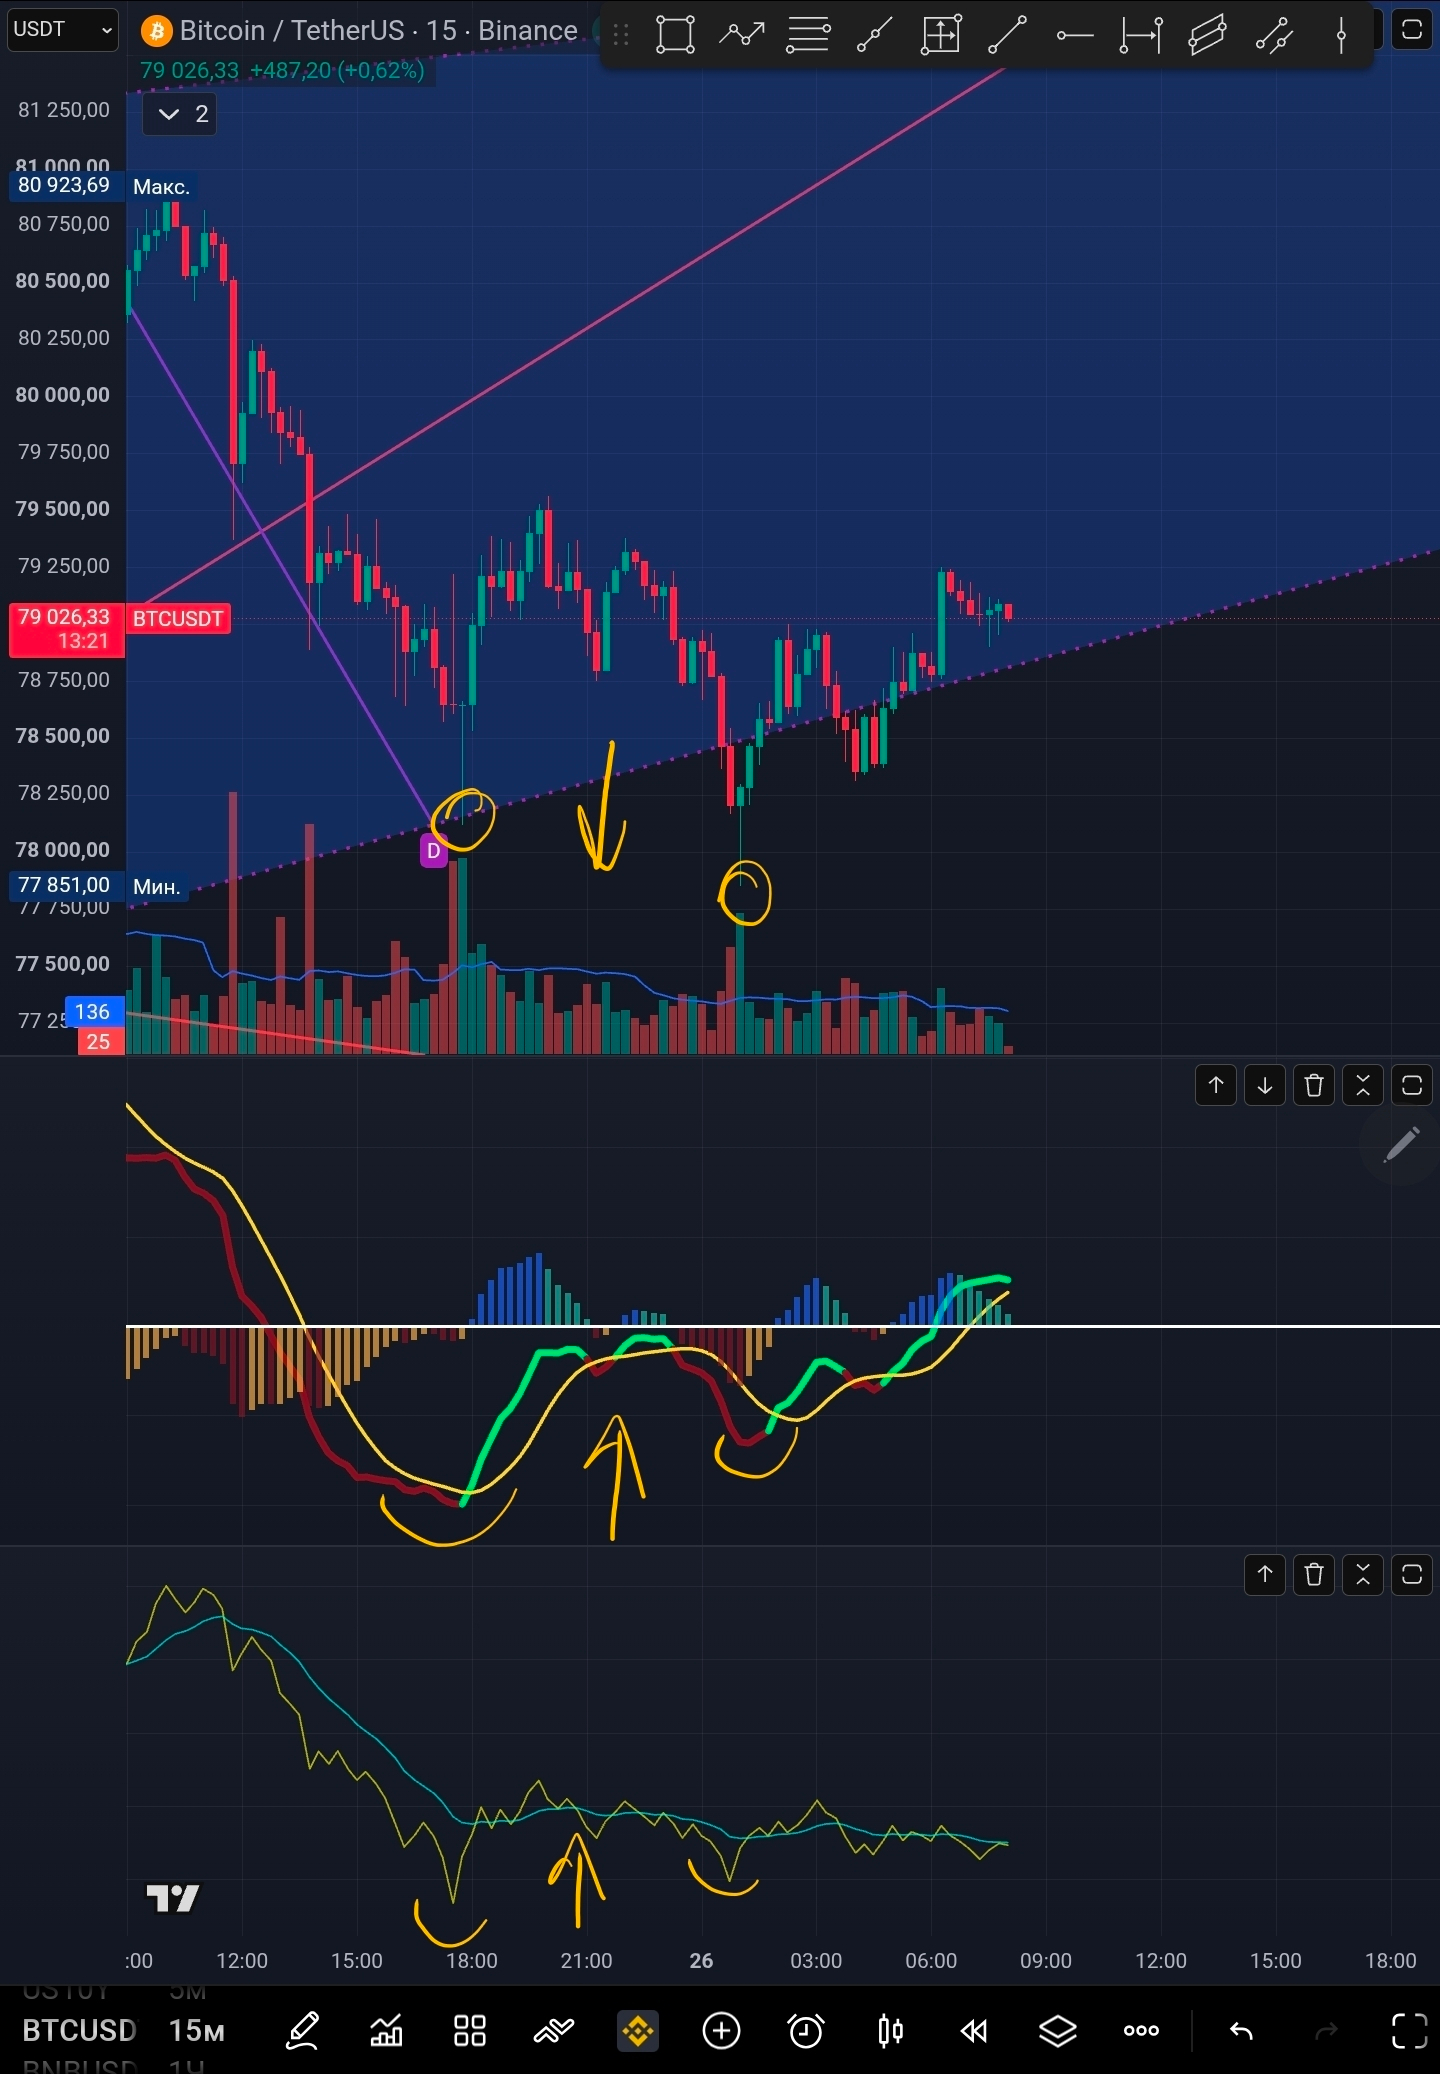
📍 On the 15-minute candles, there is a bullish divergence at the most recent lows on both indicators—a confidently positive signal.
📍 It practically doesn’t make sense to look at the heatmap right now. We have an impulsive trend move, where the upper area will always be cold, and the lower area will always be hot. The largest clusters are always around the minimums and maximums—that is, the next hot zone above will be higher than 83k. When we see consolidation within a corridor range, then the liquidation map will be useful again. The levels stay the same.
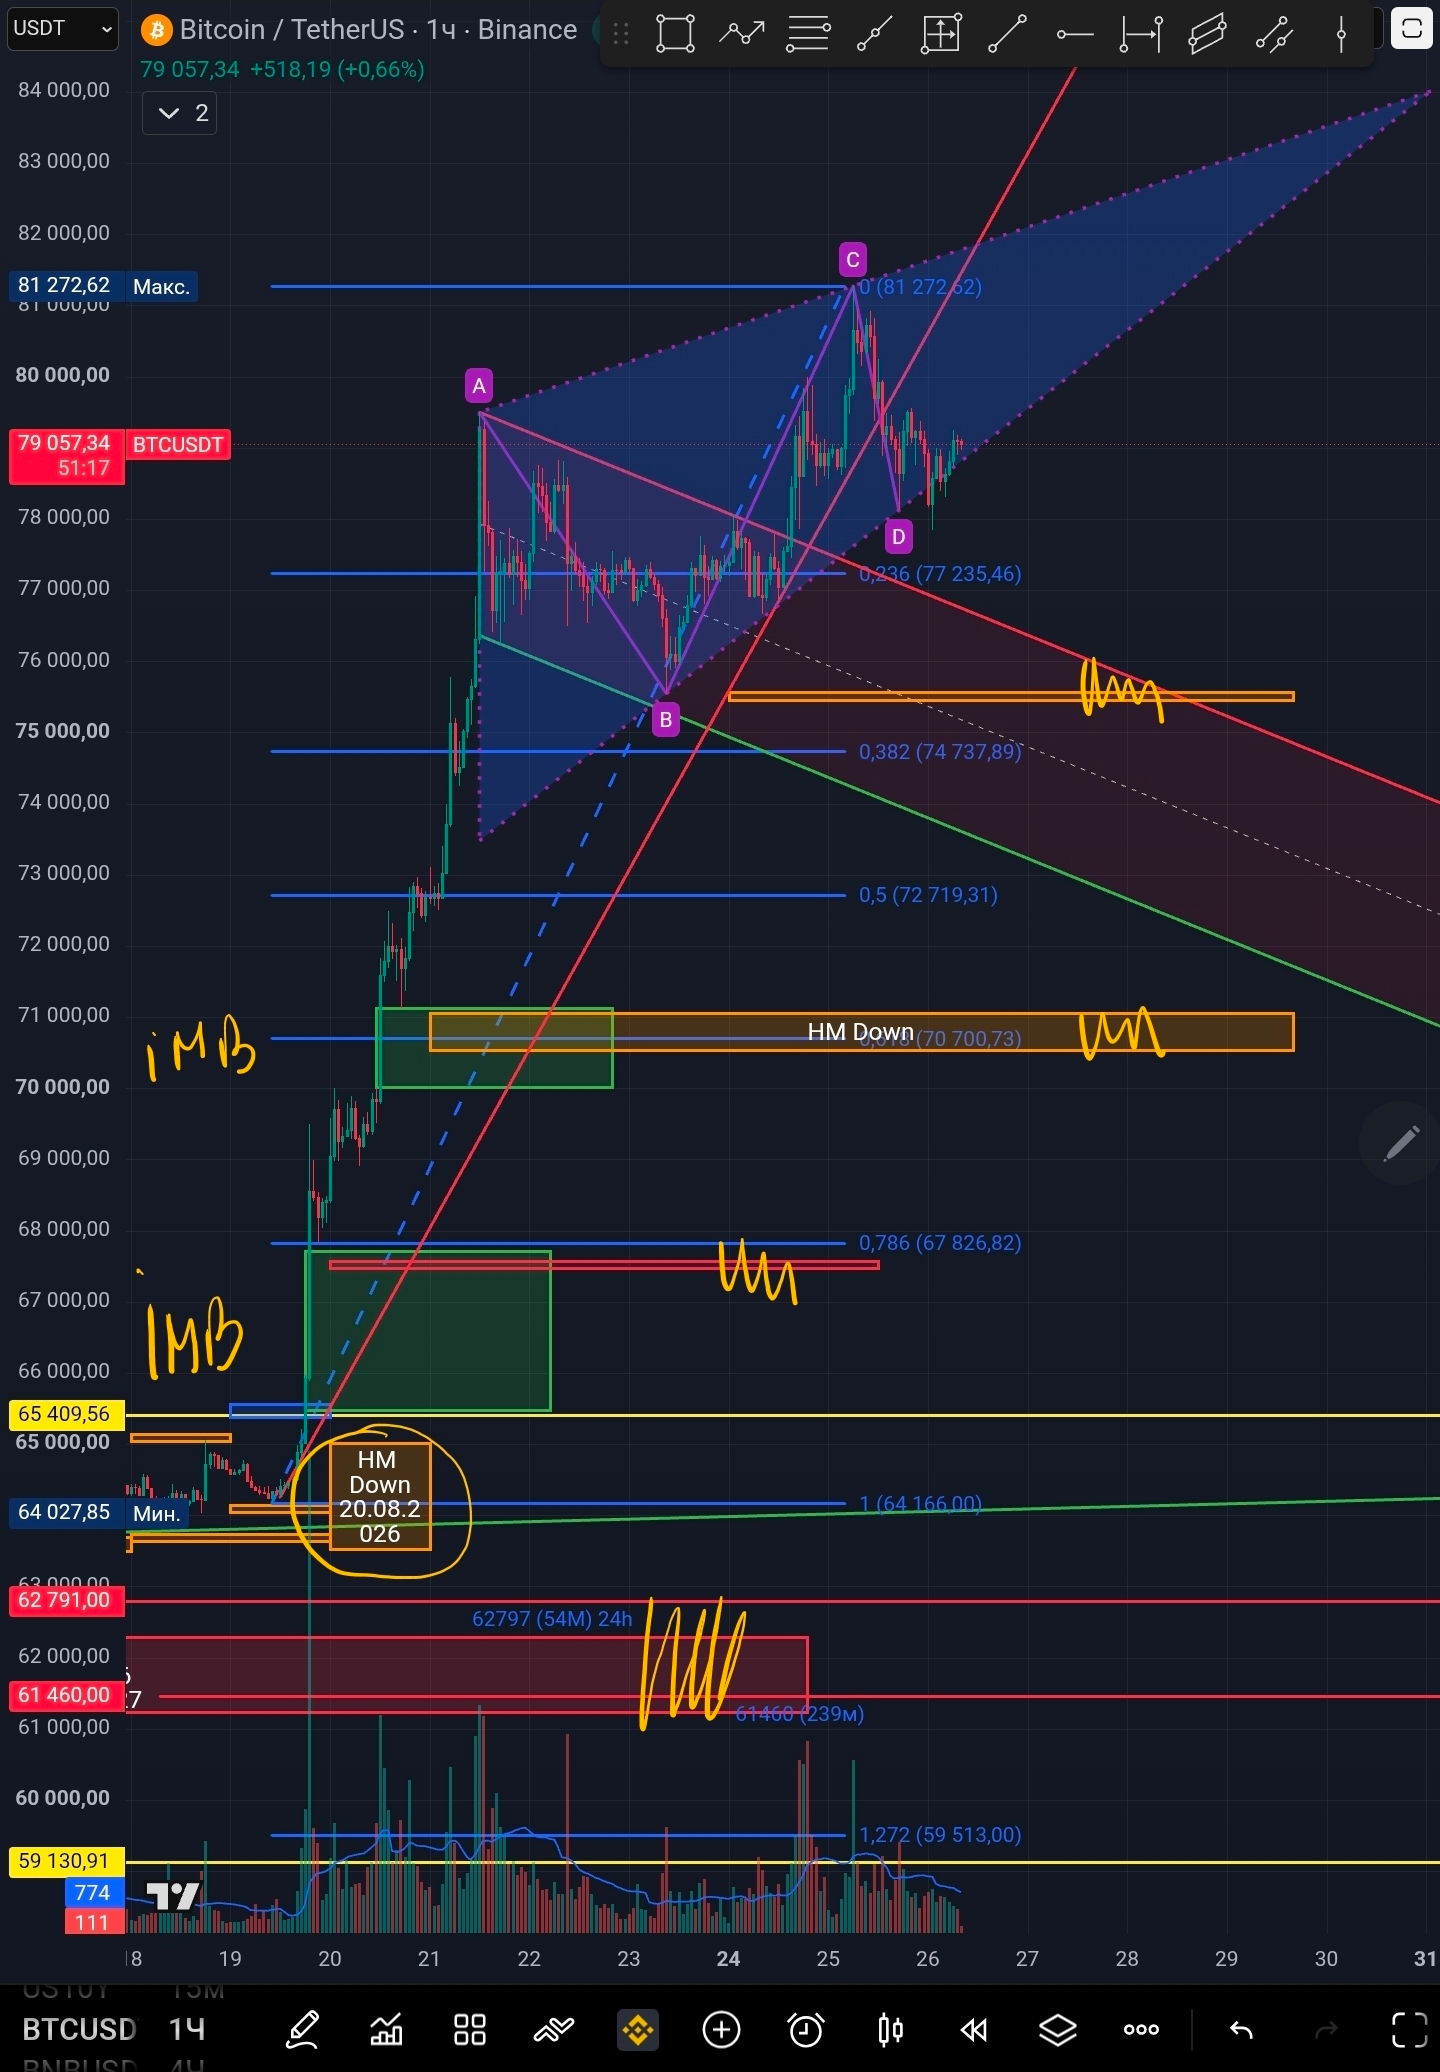
📍Here’s what I conclude for myself: we have a possible ascending triangle; and in any triangle, the movement ratio can be determined using the 0.618 coefficient of the previous move. If we need to calculate how far the move up will be, we multiply 0.618 by the length of the previous move. Depending on whether we measure from point A or from point B, the previous move will be either 7.62% or 6%. Then point E could be expected either 3.7% or 4.7% above point D.
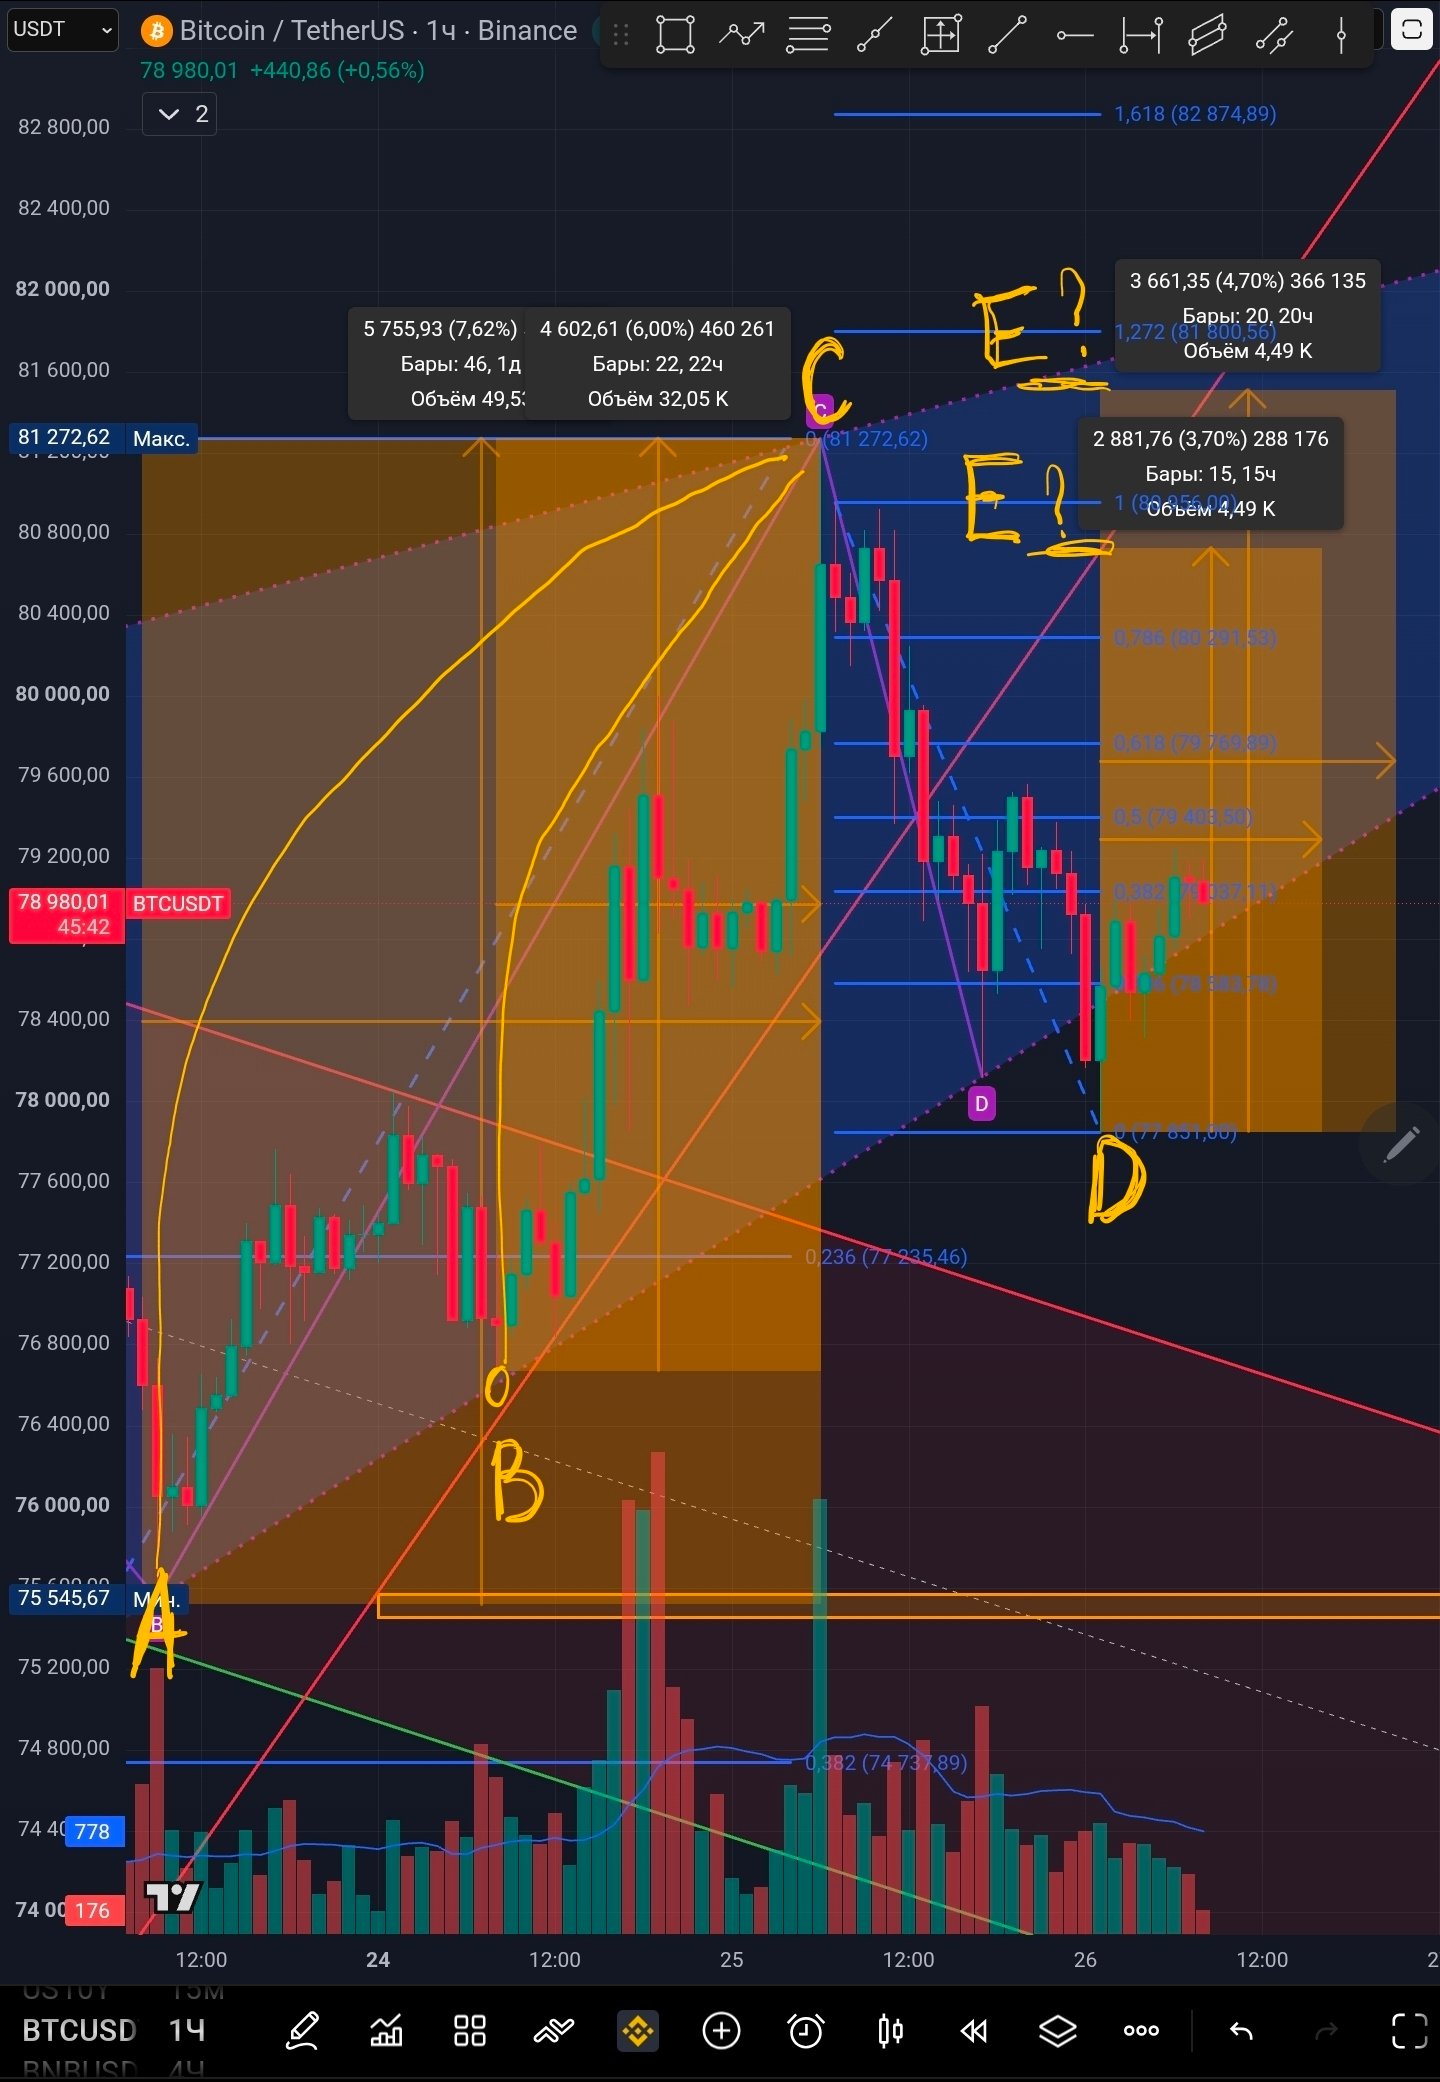
In any case, I expect a correction of the upward impulse. I started locating point E only to understand how high the price could potentially rise after the bullish divergence on the 15-minute candles (if it even wants to move up from the 15-minute signals—lower timeframes often lie).
Keep an eye on updates in the comments to this post. I’m waiting for your reasoned opinion on this situation. Use my information only as a reference for how to approach market analysis—not as your own trading strategy or financial advice. Make your trades only based on your own analysis, experience, and conclusions. Green P&L to you, my Crypto brothers 🙌.
✨✨✨
Thank you to all Crypto brothers who show activity and help me promote my content. If you like my creativity, then you can support the author and the daily releases by subscribing, commenting, reposting, liking, or using the Tips feature. Thank you in advance 🙌