EARLY-DAY OUTLOOK FOR 26/08
BTC FACES DIFFICULTIES AT 81K
*Daily chart:
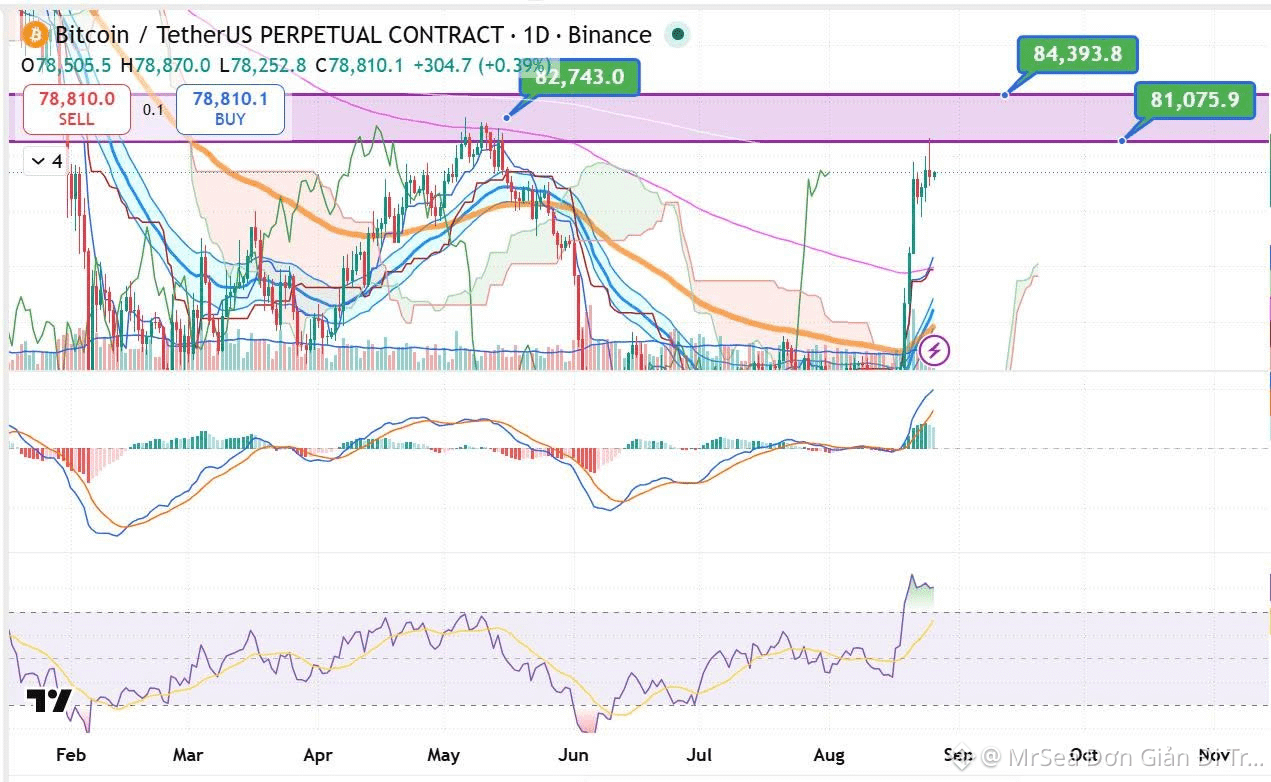
- On 25/08, BTC surged quickly up to the 81.270k area in a burst of excitement, but it then met strong selling pressure at this price zone. The session closed with BTC falling back to 78.505k, with trading volume higher than the previous day and about 20-session average. A shooting star candle formed in this area. - The Fear & Greed index is currently at 80.
- RSI: Still holding above the overbought zone >80.
- MACD: Still maintaining strong upward momentum.
*4-hour chart:
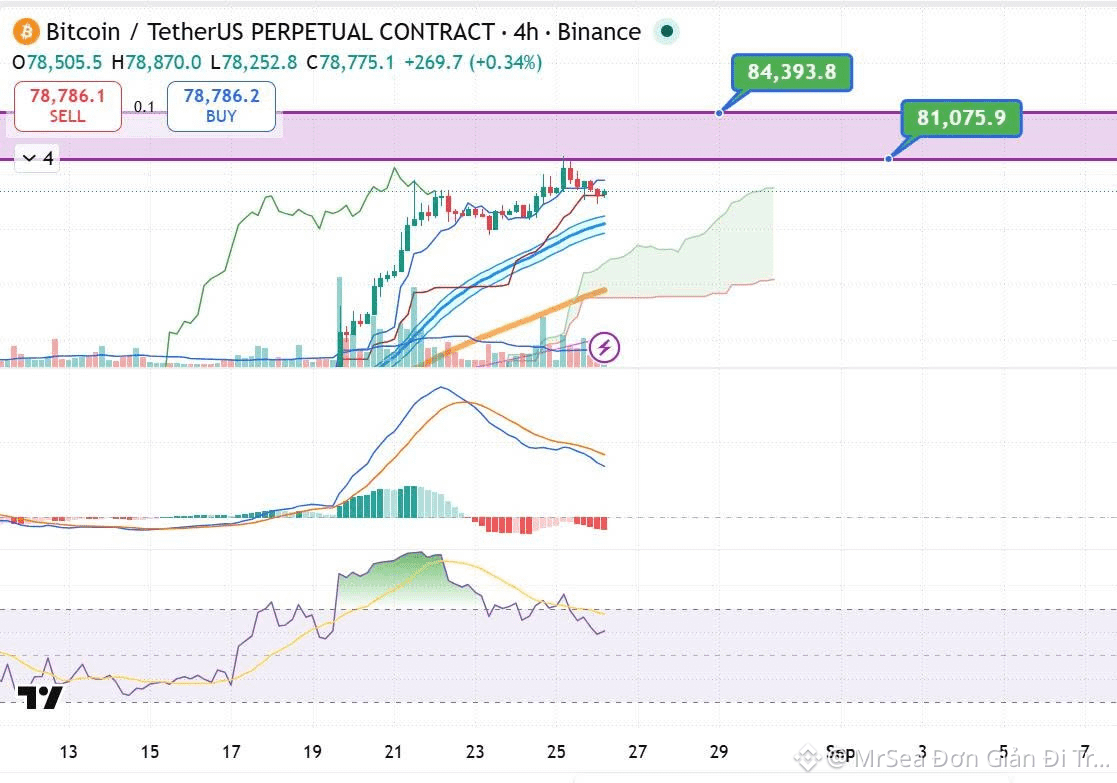
- BTC encountered resistance around the 81k zone. This session closed on the 4-hour timeframe with a Hammer candle, closing above the Kijun-sen line of the Ichimoku cloud around 78.505k, suggesting BTC is retesting the recent high on the h4 chart in this price area. The bullish structure is still intact. - BTC still has the potential to move up toward the 83k zone.
- RSI is cutting below the signal line and is moving above the 50 level.
- MACD is moving below the signal line, and the Histogram has shifted into a negative state.
+ Scenario 1: Consider BUY in the support zone 78.4k - 78.5k. Target TP: 81k - 82k.
+ Scenario 2: Consider SELL if BTC pushes up into the resistance zone 82.8k - 83k. Target TP: 79k - 80k.
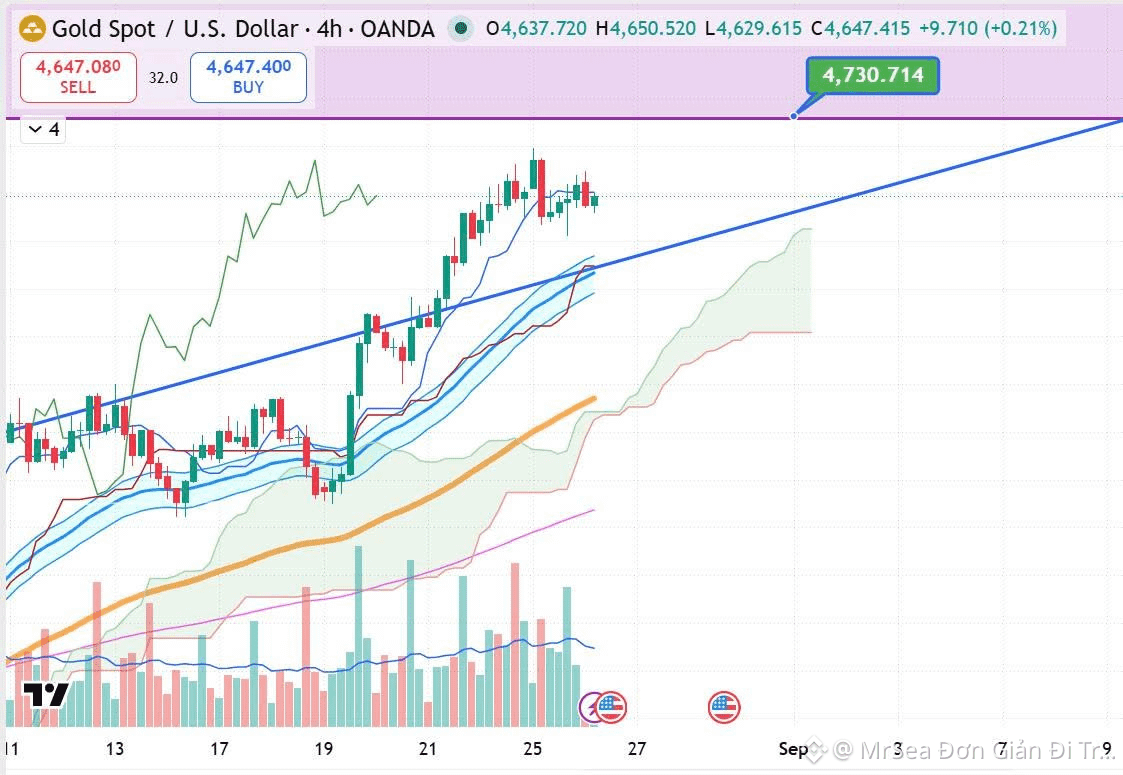
* Gold (XAU): Gold has climbed to the 4697 price zone and has shown a strong reaction there, consistent with the previous session’s assessment. The session ended with Gold pulling back to the 4659 zone - The 4750-4780 zone is an important psychological resistance.
* Oil (Oil): After the news that the U.S. Navy has removed most of its sea mines in the Strait of Hormuz and the strong intervention message toward this area from President Trump led Gold to adjust by 2.73% and close around 80.636U. Oil may test the 74U - 68U range.
+ Watch the full details in the gym personal information in the first post, everyone! @All
BTC FACES DIFFICULTIES AT 81K
*Daily chart:
- On 25/08, BTC surged quickly up to the 81.270k area in a burst of excitement, but it then met strong selling pressure at this price zone. The session closed with BTC falling back to 78.505k, with trading volume higher than the previous day and about 20-session average. A shooting star candle formed in this area. - The Fear & Greed index is currently at 80.
- RSI: Still holding above the overbought zone >80.
- MACD: Still maintaining strong upward momentum.
*4-hour chart:
- BTC encountered resistance around the 81k zone. This session closed on the 4-hour timeframe with a Hammer candle, closing above the Kijun-sen line of the Ichimoku cloud around 78.505k, suggesting BTC is retesting the recent high on the h4 chart in this price area. The bullish structure is still intact. - BTC still has the potential to move up toward the 83k zone.
- RSI is cutting below the signal line and is moving above the 50 level.
- MACD is moving below the signal line, and the Histogram has shifted into a negative state.
+ Scenario 1: Consider BUY in the support zone 78.4k - 78.5k. Target TP: 81k - 82k.
+ Scenario 2: Consider SELL if BTC pushes up into the resistance zone 82.8k - 83k. Target TP: 79k - 80k.
* Gold (XAU): Gold has climbed to the 4697 price zone and has shown a strong reaction there, consistent with the previous session’s assessment. The session ended with Gold pulling back to the 4659 zone - The 4750-4780 zone is an important psychological resistance.
* Oil (Oil): After the news that the U.S. Navy has removed most of its sea mines in the Strait of Hormuz and the strong intervention message toward this area from President Trump led Gold to adjust by 2.73% and close around 80.636U. Oil may test the 74U - 68U range.
+ Watch the full details in the gym personal information in the first post, everyone! @All