


BTC just broke above 80,000 and then pulled back; ETH also touched $2,533 and fell back to $2,456. The square is asking, “Is the catch-up rally over?”—look at it another way: who is picking up orders above $2,500? Is it turnover flowing into the strong hands, or is FOMO grabbing the final baton?
First, look at Binance ETH/USDT data (2026-08-26 09:06 CST):
· Current price about $2,456 · 24h range $2,415 – $2,533 (amplitude ~5%) · 24h -1.6%, 7 days +18% · 24h trading volume about $313M, ~0.7x the 7-day average · About -3.6% from the recent high of $2,547
Meanwhile, the comparison: BTC 7d +15%, ETH outperformance about +2.7pp. ETH/BTC over the last 30 days about +3.7%.
Supporting evidence: the U.S. spot ETH ETF saw net inflows of about $697M last week, making it one of the strongest weeks in the past ~10 months.

I. $2500 isn’t an “integer-integer” number—it’s the dividing line for this round of catch-up
In the past ~60 trading days, the number of times ETH’s daily candle closed and held above $2,500 is: 0.
This round was pulled up from around $1,900, topping out near $2,547, and now it has slipped back to $2,456. Structurally, it’s a “pullback after testing the level,” not a “platform confirmation after holding.”
From the capital perspective: touching $2,500 is a testing move. A daily close is what completes the process—selling out low-level chips while letting the late-chasing buyers get pulled in.
In the chart, the yellow line is the $2,500 boundary. The shaded area below is the main dense trading zone from the past two months.
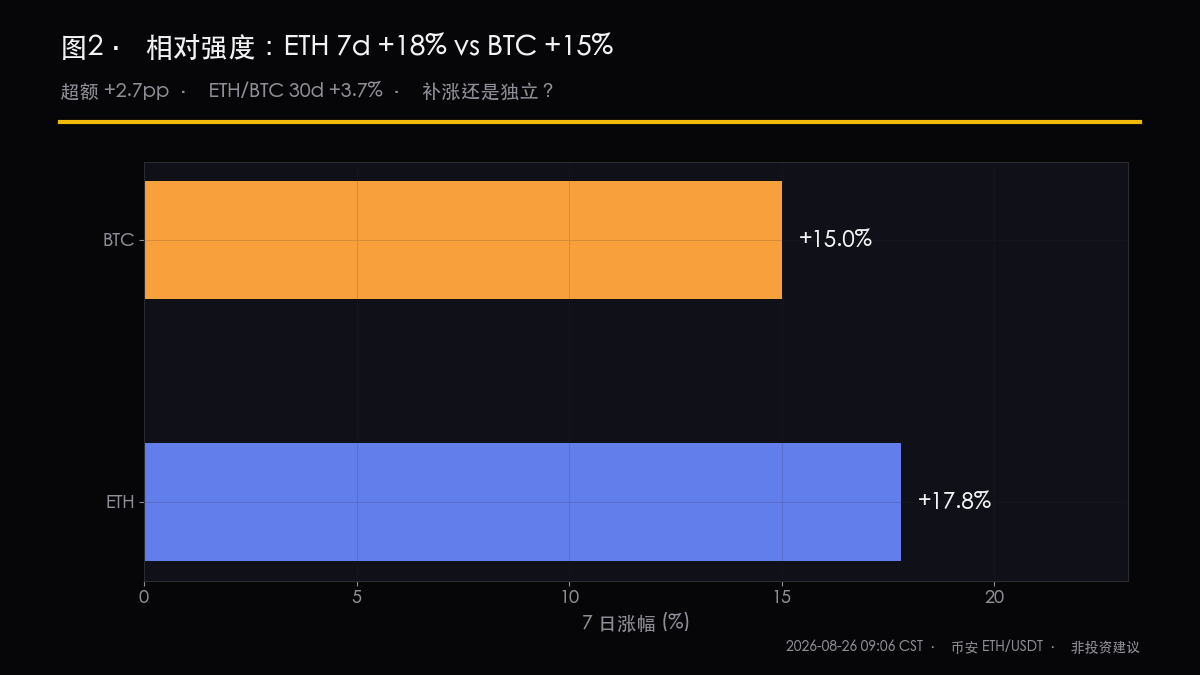
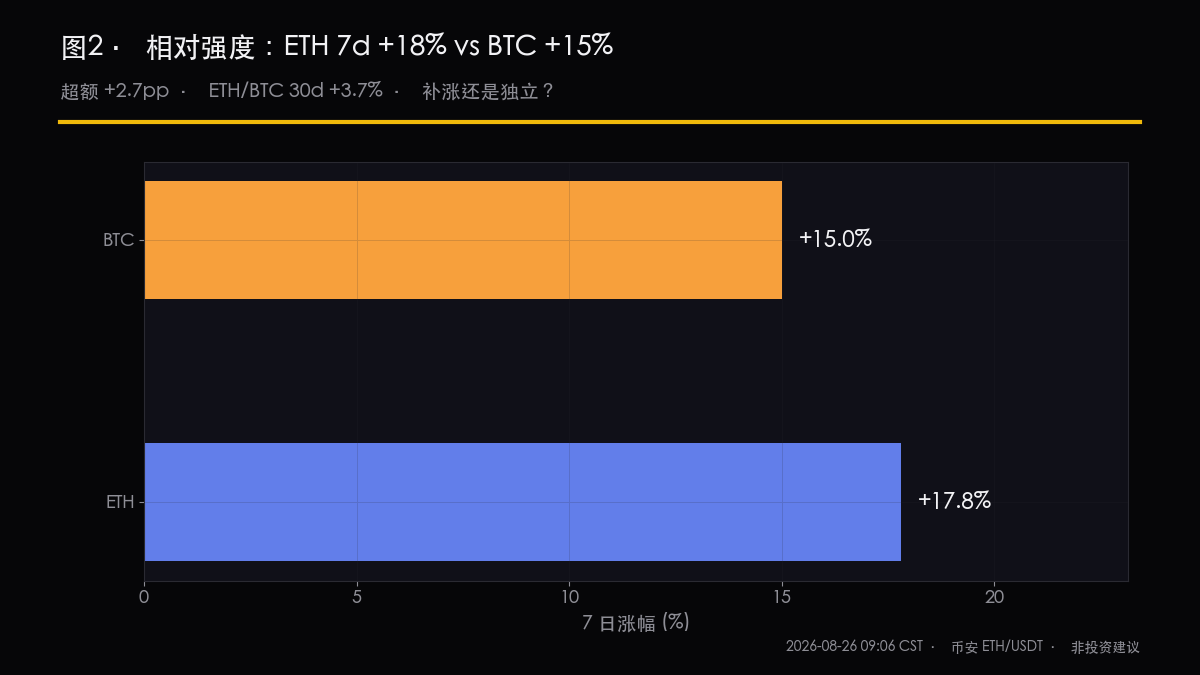
II. Relative strength: ETH is slightly stronger than BTC, but not strong enough to count as an independent primary uptrend
7-day price change:
· ETH +18% · BTC +15%
ETH is ahead of BTC by about 2.7 percentage points; over the past ~30 days, ETH/BTC is about +3.7%.
In plain terms: this move looks more like BTC led first, and then ETH is playing catch-up to repair—this is not ETH starting a brand-new independent trend. The catch-up can continue, but don’t treat “following up” as “the primary uptrend is confirmed.”
III. Who’s buying: ETFs have a bid/“tray” of orders, futures contracts aren’t going crazy, but spot volume is cooling off
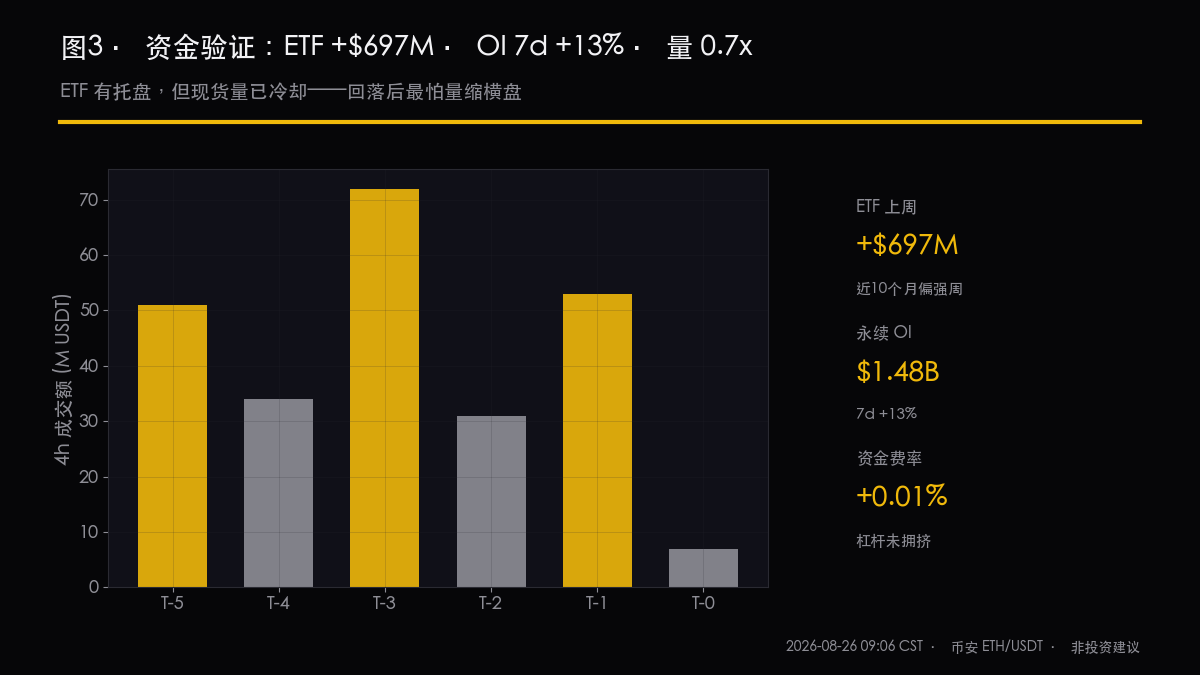
Three layers of capital, look at them separately:
· Spot ETF last week about +$697M — real buying on the institutional side; the catch-up is “worth something” · Perps OI about $1.48B, +13% over 7 days — additional positions, but not extreme · Funding rate +0.01% — longs aren’t overcrowded yet · Spot volume only 0.7x the 7-day average — volume is shrinking during the pullback; this is the biggest risk right now
Past 6 consecutive 4H candles’ trading value (B): 0.051 → 0.034 → 0.072 → 0.031 → 0.053 → 0.007.
The higher-price surge had volume, but after the pullback the volume dropped clearly. Watch out for this combo: price stuck between $2,400–$2,500 + OI continues to rise + spot volume continues to shrink. That’s leverage being stacked near a level, not healthy turnover.
IV. Key levels and two scenarios
Price level — meaning: extension target 2 is $2,800; the emotion/acceleration zone extends to target 1 at $2,600; you need to hold above $2,500 with increased volume for the bull-bear line to be considered settled. Only when the daily closes strong does it count as a breakout above $2,400; the probability of a false breakout increases, and a structural break below $2,200 would end the catch-up logic.
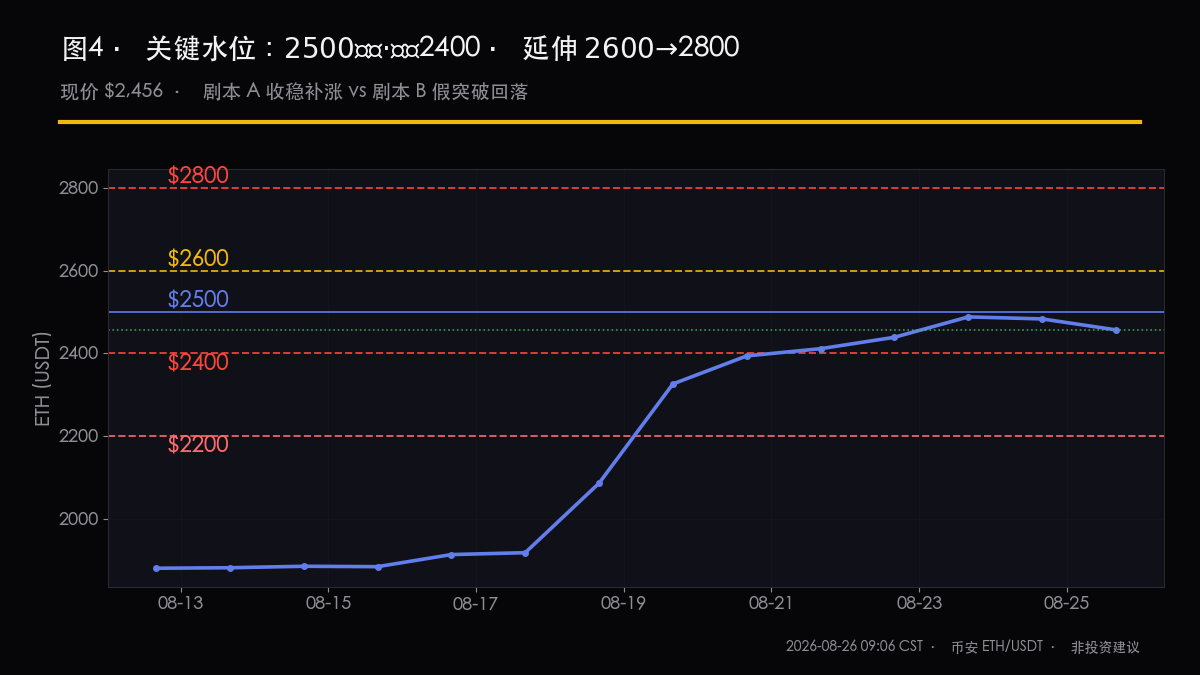
Scenario A (close-and-hold catch-up): daily closes above $2,500 → then a lower-volume pullback toward the $2,400 area → strong volume breaks above $2,600 → then watch $2,800.
Scenario B (false breakout and pullback): touches $2,533 but can’t close back above → volume contracts, OI spikes uniquely → breaks below $2,400 → treat it as a stop-and-go bear/bull trap around that level
Current price is $2,456—stuck between “it already touched” and “it hasn’t closed and held.” The more the crowd is rushing to declare the catch-up is over or the primary uptrend is confirmed, the more likely the funds are still rotating/redistributing.
II. The link between BTC breaking 80k and what follows for ETH
Same rhythm, different positions:
· BTC moves first: breaks 80k, tests the platform · ETH follows up later: taps $2500 and tests the key level
If BTC can hold steady at 78k–80k, ETH still has a chance to turn $2,500 from resistance into support. If BTC quickly drops back below 78k, ETH will be hard to run as an independent bull—high beta pullbacks usually happen faster.
Over the next 48 hours, whether BTC can defend 80k/78k matters more than whether ETH prints a single bullish candle on its own.
VI. Conclusion (not investment advice)
The bullish repair is partially valid, but $2,500 still hasn’t completed the “hold and stand” step.
Already in the market: waiting for a daily close to hold above $2,500 is safer than buying on the high candle during the initial push. Not in yet: a lower-volume pullback around $2,400 is a better observation zone.
Next, just watch two tiers: $2,500 and $2,400. If the former holds, the catch-up structure stays intact; if the latter breaks, reassess the setup and treat it as an upside trap at that level.#ETH $ETH
