$MINIMAX $WLFI 30 minutes MACD golden cross with volume surge—who’s stronger?🔥
════════════════════
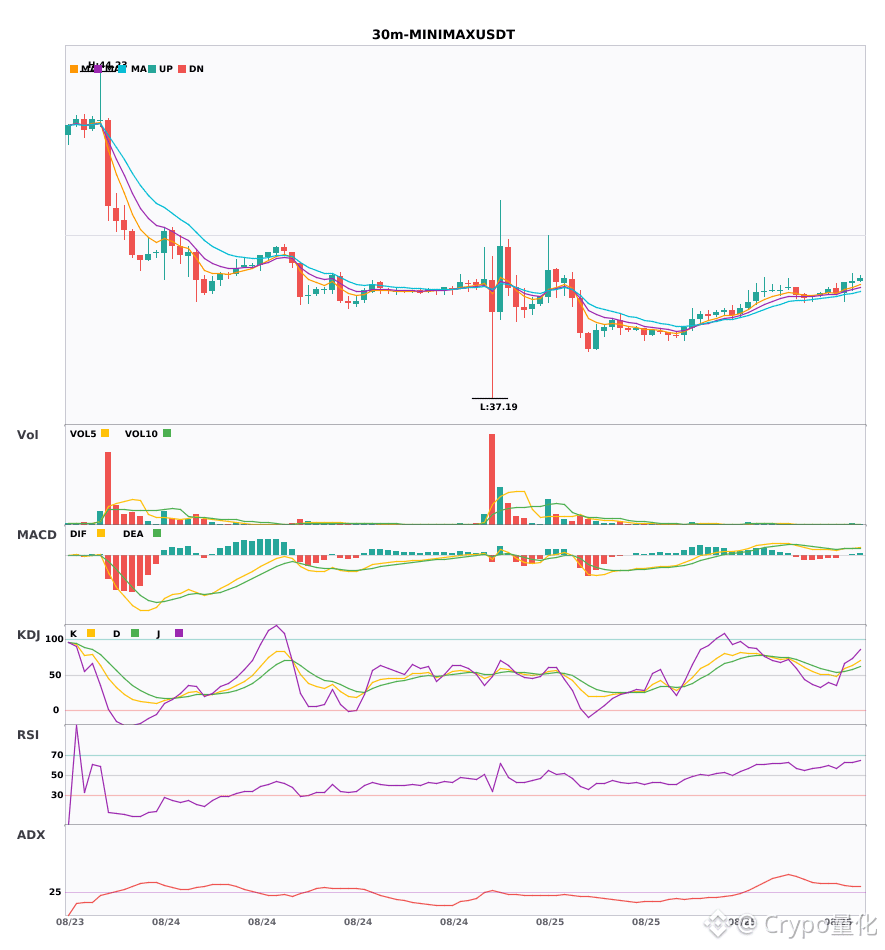
🔴 $MINIMAX 30 minutes Bullish signal
⚠️ Technicals: DMI shows 33, indicating a clear trending market. MACD has a golden cross above the zero axis—bullish momentum is picking up. The 5-, 8-, and 13-day moving averages are in bullish alignment and fanning upward. KDJ shows a golden cross, with K at 59—no overbought yet. Trading volume is up twofold, very strong.
════════════════════
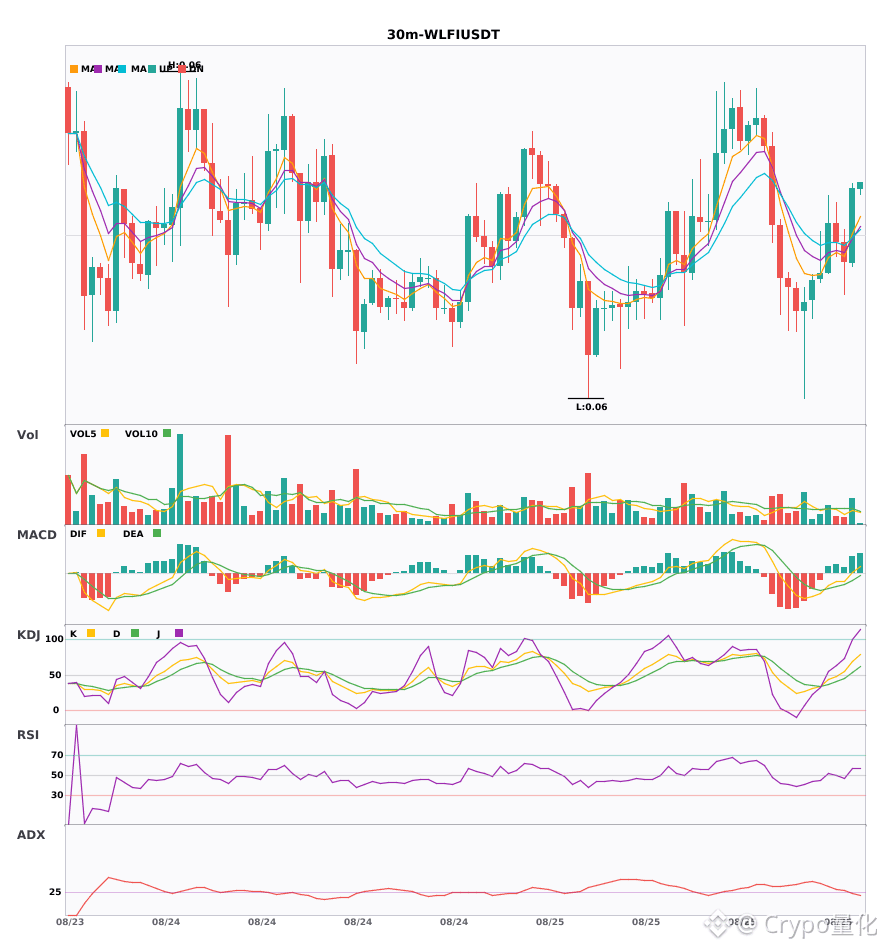
🔴 $WLFI 30 minutes Bullish signal
⚠️ Technicals: ADX 25 suggests the trend is forming—worth keeping an eye on. After the MACD golden cross, the volume expands; the red histogram bars get longer, and the uptrend is taking shape. The 5-day moving average crosses above the 8-day—bullish in the short term. KDJ shows K crossing above D; it hasn’t entered the overbought zone yet, and is running strongly. Volume is also up 1.6x, with volume confirming the move.
════════════════════
🔔 Follow to get first-hand market moves 🔔
#技术分析 #MINIMAX #WLFI
📌 When trading, pay attention to whether the candlestick pattern matches
════════════════════
🔴 $MINIMAX 30 minutes Bullish signal
⚠️ Technicals: DMI shows 33, indicating a clear trending market. MACD has a golden cross above the zero axis—bullish momentum is picking up. The 5-, 8-, and 13-day moving averages are in bullish alignment and fanning upward. KDJ shows a golden cross, with K at 59—no overbought yet. Trading volume is up twofold, very strong.
════════════════════
🔴 $WLFI 30 minutes Bullish signal
⚠️ Technicals: ADX 25 suggests the trend is forming—worth keeping an eye on. After the MACD golden cross, the volume expands; the red histogram bars get longer, and the uptrend is taking shape. The 5-day moving average crosses above the 8-day—bullish in the short term. KDJ shows K crossing above D; it hasn’t entered the overbought zone yet, and is running strongly. Volume is also up 1.6x, with volume confirming the move.
════════════════════
🔔 Follow to get first-hand market moves 🔔
#技术分析 #MINIMAX #WLFI
📌 When trading, pay attention to whether the candlestick pattern matches