


(And Why Most Traders Use Them Incorrectly)
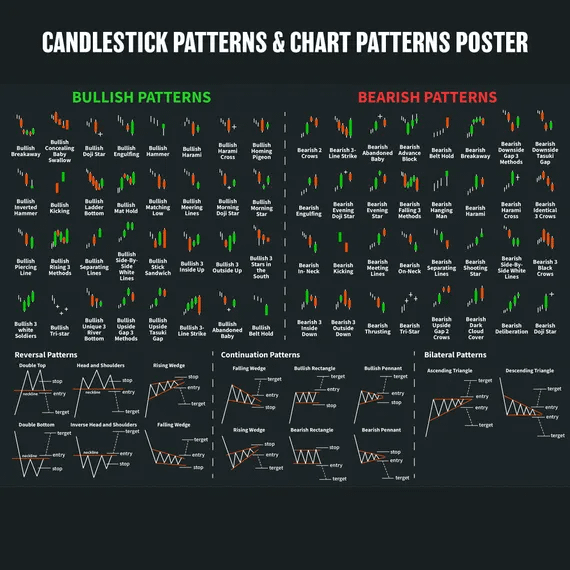
Japanese candlesticks are one of the most popular tools in technical analysis.
You see hammer, engulfing, doji, morning star… and think:
“Ready, now I know when to buy and sell.”
❌ Classic error.
Most traders lose money precisely because they use candlesticks out of context, as if they were magic signals.
In this article you will learn:
What a candlestick really represents
How to read the most used patterns
Why they fail in practice
And how to use candlesticks correctly and professionallycorrectly and professionally
🕯️ What Does a Candlestick Really Represent?
Before the patterns, understand the basics:
Each candle shows a battle between buyers and sellers in a time period.
It contains:
Opening
High
Low
Closing
The shape of the candle reveals who had control during that period — and with what intensity.
👉 Candlesticks do not predict the future
👉 They show what just happened to the price
🔍 The Most Popular Candlestick Patterns
1️⃣ Hammer and Inverted Hammer
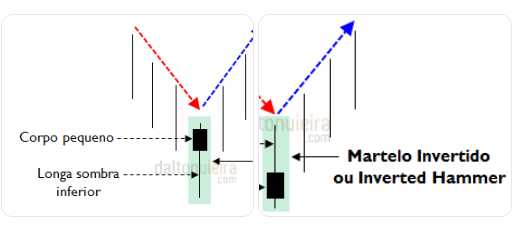
What the average trader thinks:
"Hammer = guaranteed buy"
What the hammer really says:
The price dropped sharply
The buyers reacted
They managed to close near the opening
📌 Correct reading
Only has value after a decline
Better if it appears in a support area
High volume strengthens the signal
❌ Common mistake
Buying any hammer in the middle of the chart
Ignore larger trend
2️⃣ Bullish Engulfing and Bearish Engulfing
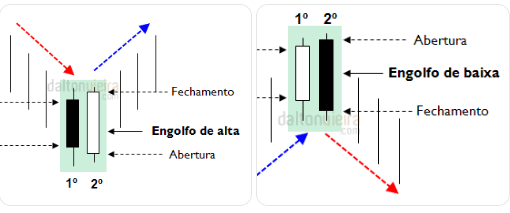
What it looks like:
A large candle "engulfing" the previous one
What it really means:
Momentary change of control
One side was dominated strongly
📌 Correct reading
Works better:
At tops or bottoms
After extended movements
Confirm with:
Volume
Market structure
❌ Common mistake
Trade every engulfing in isolation
Ignore that the market may be sideways
3️⃣ Doji
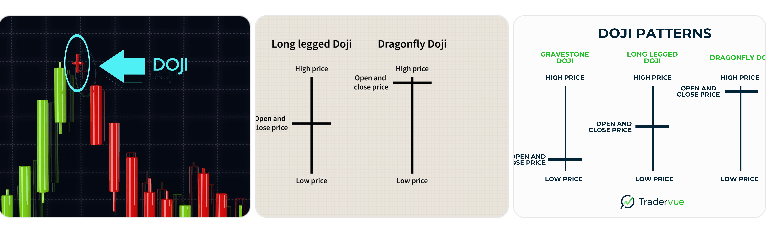
The doji shows indecision.
📌 What it Is NOT
Not a buy signal
Not a sell signal
📌 What it Is
A warning: "the market may change"
Works better:
At tops after a strong rise
At bottoms after a strong drop
Near important zones
❌ Common mistake
Trade doji as if it were an automatic reversal
4️⃣ Morning Star and Evening Star
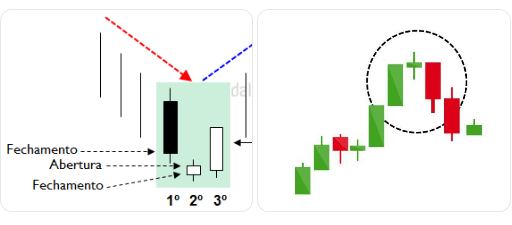
They are patterns of three candles, indicating a gradual transition of strength.
📌 Correct reading
They represent loss of momentum
They need:
Context
Confirmation in the next candle
❌ Common mistake
Anticipate entry before confirmation
Ignore main trend
🚨 Why Most Traders Use Candlesticks Wrong?
❌ Error 1: Using Isolated Candlestick
No candle works alone.
Candlestick without context = weak signal
❌ Error 2: Ignore Trend
Reversal patterns work better against extremes
Not in the middle of a strong trend
❌ Error 3: Don't Look at the Larger Timeframe
A hammer in 5 minutes:
It can just be noise
Against a strong trend on the daily
❌ Error 4: Not Using Risk Management
Even the best pattern:
Failure
Always
Without stop loss, the problem is not the candle, it's the trader.
✅ How to Use Candlesticks Correctly (Professional Method)
Use candlesticks as confirmation, not as an isolated trigger.
Checklist before trading:
✔ Clear trend
✔ Support or resistance area
✔ Coherent candle pattern
✔ Volume confirming
✔ Defined stop
✔ Calculated risk
👉 Candlestick answers the question:
"Is the market confirming what I already suspected?"
🧠 Conclusion
Candlesticks are powerful — when used correctly.
❌ They are not magic signals
✅ They are tools for reading human behavior
Traders that lose money:
They memorize patterns
They ignore context
Consistent traders:
They understand the story behind the candle
They use structure, trend, and management
📌 Candlestick does not predict the future — it reveals the market's intention.
