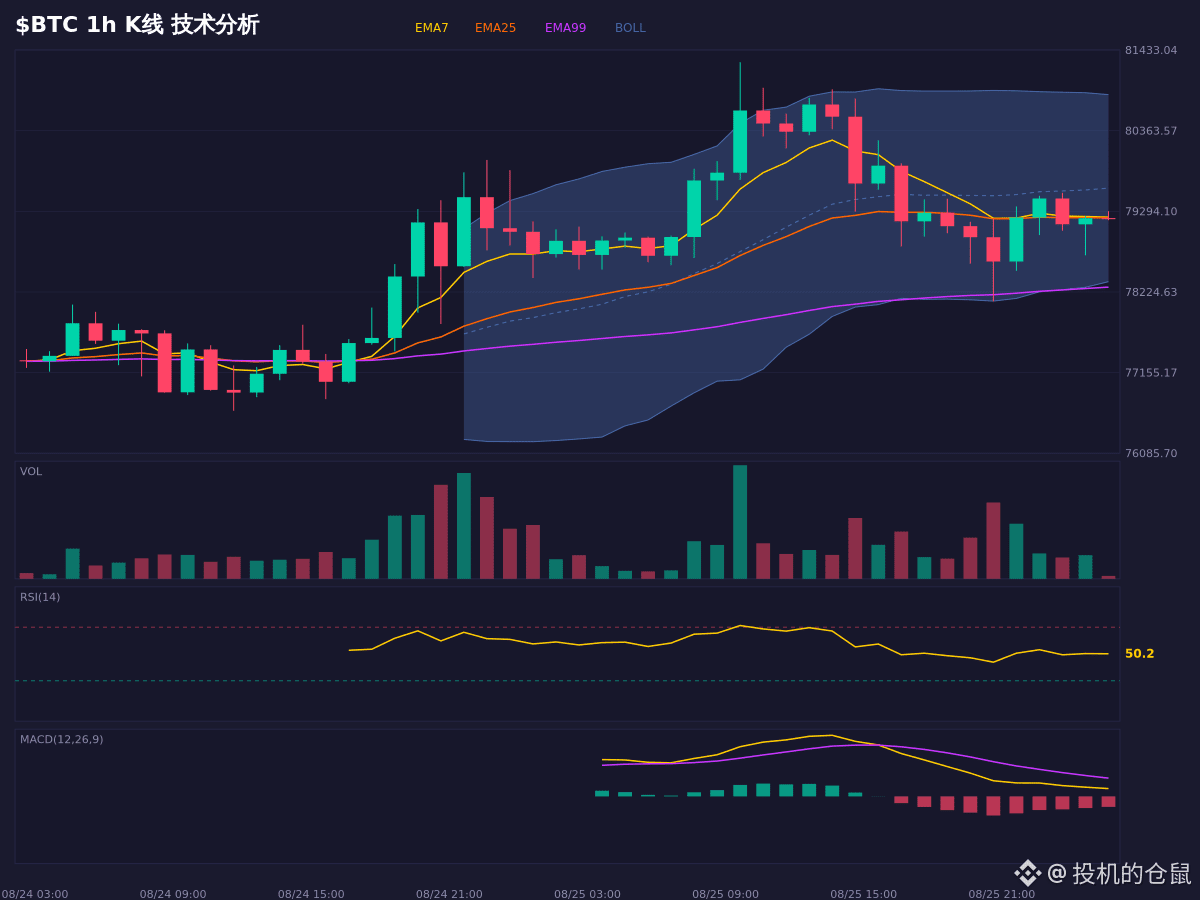
Just brewed a cup of coffee, stared at the chart for half an hour, and the $BTC trend looks a bit interesting. The moving averages and RSI both show a bullish alignment, and the price has moved above the EMA25, but the MACD is still sounding bearish, with OBV also showing signs of money flowing out. This up move feels a little “pumped up,” like the main force is propping up the price to distribute.?
The support level is in the 79685~80059 range. If price can hold above this area, the bullish structure may still continue. The logic invalidation level is around 78878—once it breaks below the current bullish logic, you’ll need to move on.
In the short term, bullish-bearish divergence is clear. Chasing after a surge is high risk; it’s better to wait for a pullback to find opportunities.
Only for chart observation and scenario analysis; it does not constitute a record of trading operations.
$BTC #熊市 #交易 #行情分析
The support level is in the 79685~80059 range. If price can hold above this area, the bullish structure may still continue. The logic invalidation level is around 78878—once it breaks below the current bullish logic, you’ll need to move on.
In the short term, bullish-bearish divergence is clear. Chasing after a surge is high risk; it’s better to wait for a pullback to find opportunities.
Only for chart observation and scenario analysis; it does not constitute a record of trading operations.
$BTC #熊市 #交易 #行情分析