I’ve been thinking about a different way to read Dusk’s numbers.
A growing stake, rising transactions, or more tokenized assets can all look positive on their own. But none of them, by themselves, tell us whether network demand is actually becoming stronger.
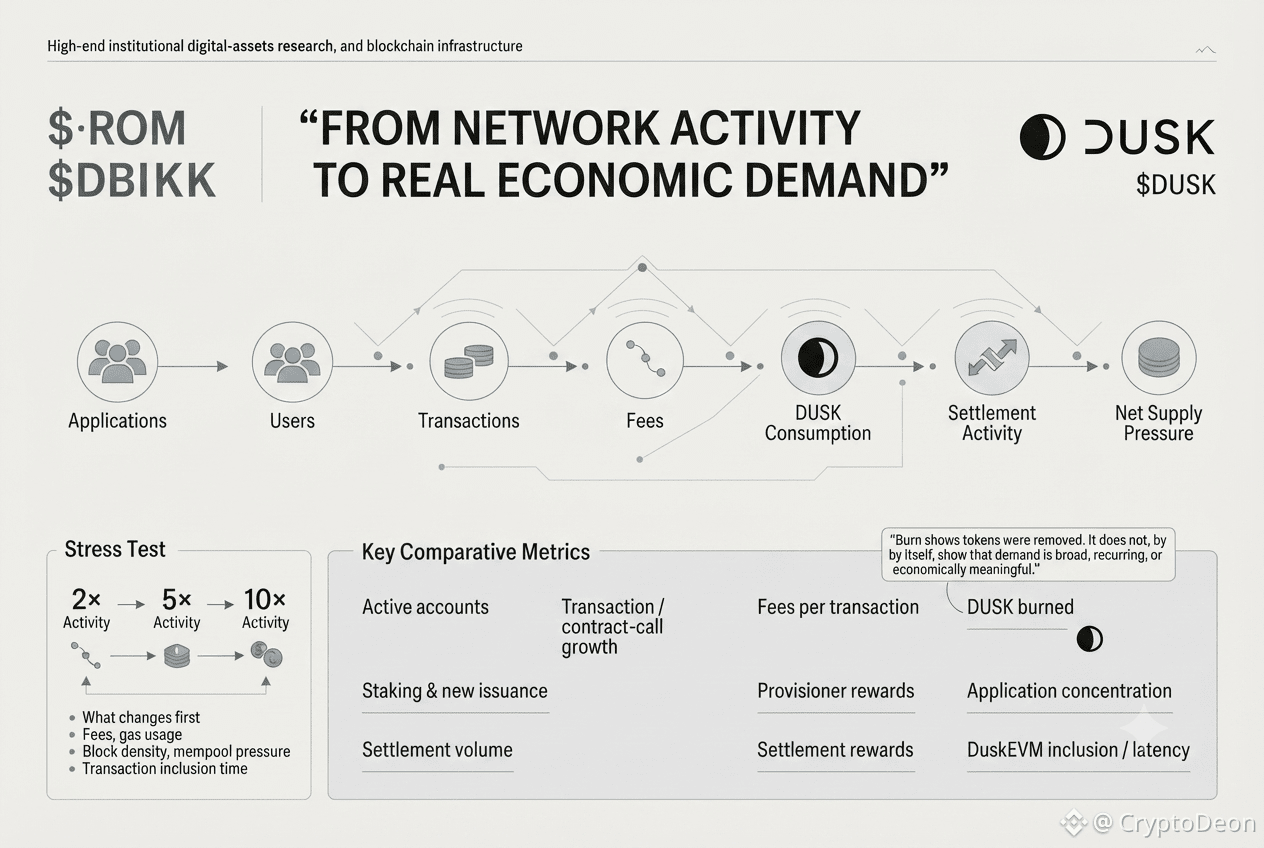
The useful question is what happens between activity and economics.
If Dusk adds more applications, does that produce more finalized transactions and fee-paying activity? If transaction counts rise, is that because existing users are becoming more active, or because a few contracts are generating most of the traffic?
I’d also separate announced assets from assets that are actually being issued, transferred, and settled on-chain.
That distinction matters.
For me, the more useful dashboard would connect:
• active accounts
• transaction and contract-call growth
• fees per transaction
• DUSK burned
• staking and new issuance
• validator/provisioner rewards
• settlement volume
• concentration by application
• DuskEVM block and inclusion metrics
Then stress-test the system.
At 2× activity, does the network absorb it normally?
At 5×, where do fees or latency begin changing?
At 10×, does capacity become the constraint?
Those scenarios tell us much more than a single daily burn number.
A burn confirms that tokens were removed. It doesn't tell us whether the underlying activity was broad, recurring, or economically meaningful.
That’s the part of Dusk I think is worth watching next.
@Dusk $DUSK #dusk
A growing stake, rising transactions, or more tokenized assets can all look positive on their own. But none of them, by themselves, tell us whether network demand is actually becoming stronger.
The useful question is what happens between activity and economics.
If Dusk adds more applications, does that produce more finalized transactions and fee-paying activity? If transaction counts rise, is that because existing users are becoming more active, or because a few contracts are generating most of the traffic?
I’d also separate announced assets from assets that are actually being issued, transferred, and settled on-chain.
That distinction matters.
For me, the more useful dashboard would connect:
• active accounts
• transaction and contract-call growth
• fees per transaction
• DUSK burned
• staking and new issuance
• validator/provisioner rewards
• settlement volume
• concentration by application
• DuskEVM block and inclusion metrics
Then stress-test the system.
At 2× activity, does the network absorb it normally?
At 5×, where do fees or latency begin changing?
At 10×, does capacity become the constraint?
Those scenarios tell us much more than a single daily burn number.
A burn confirms that tokens were removed. It doesn't tell us whether the underlying activity was broad, recurring, or economically meaningful.
That’s the part of Dusk I think is worth watching next.
@Dusk $DUSK #dusk