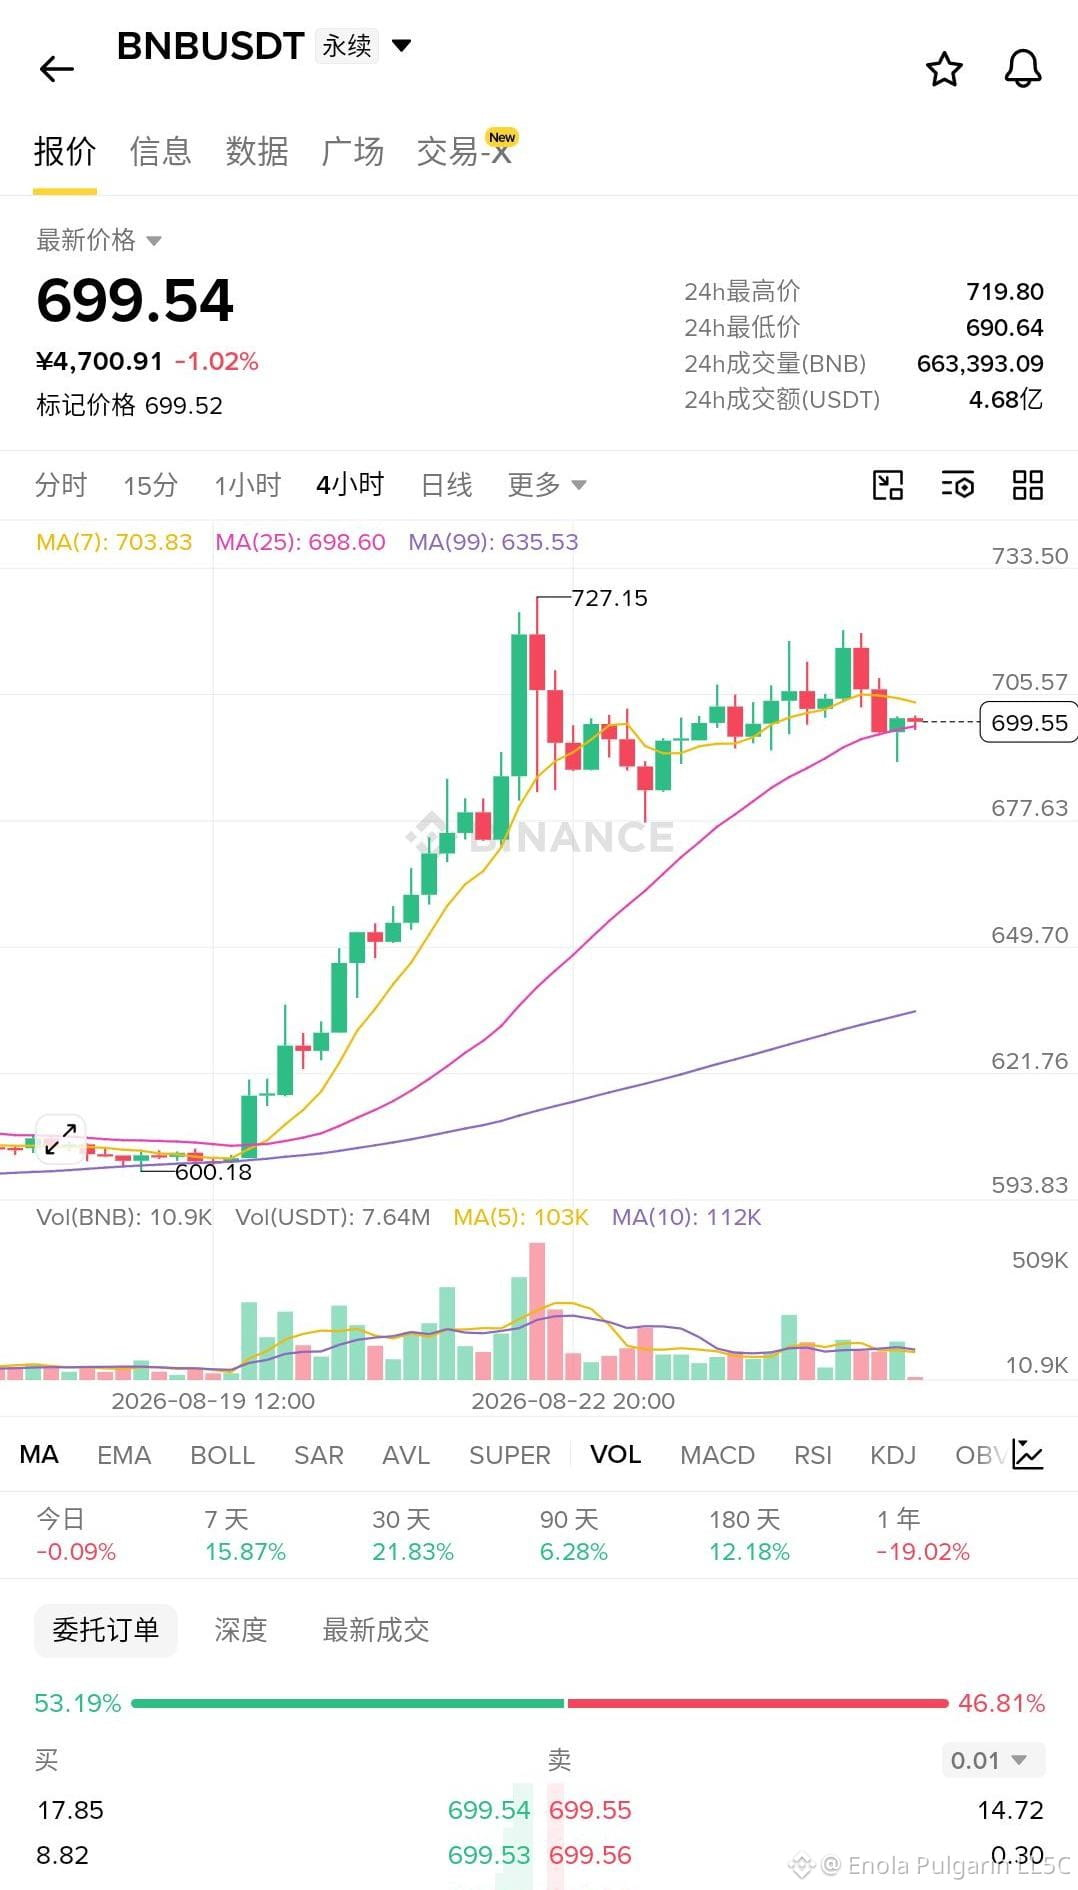
BNB surged 15% over seven days (600 to 727). Yesterday was the point where it finally officially hit a wall: on the daily chart, a single candle dropped straight from 719.57 to 690.84, with an amplitude of nearly 4%, and it closed at 700 right along the daily low. A long upper wick that closed near the low isn’t a pullback—it’s the endpoint of the momentum from this leg.
Most striking is the spot taker activity near the close: the sell volume is nearly ten times the buy volume (18.154 vs 1.818). In about 100 trades, it was almost one-sided—dumping directly into the bid. Meanwhile, in the open interest position distribution across four quadrants, everything is concentrated in bear_strong; as price falls, OI is still pushing higher—bulls are trapped above the 719 top, and the liquidation wave could ignite at any moment.
On the funding side, it’s also reversing: whale leveraged positions were cut by 1.99% over 7 hours; on-chain lending dropped sharply 38.5% within 12 hours; and the funding rate flipped from positive pressure back to 0. Even if there are 12 consecutive green spot candles within 3 hours, that’s still “buying at the top” and becoming trapped liquidity—it’s not new demand.
I’ll say it plainly: short. 699-704 is the entry zone. First target is 690—the yesterday low. If that breaks, look for 677 (the 3-day low). Stop loss is above 720. This isn’t guaranteed to fall—it’s just that the odds are bearish: three things line up at once—overbought, trapped longs, and a retreat in capital.
Conditions for a reversal: if price regains volume and holds above 719.8, and the spot taker flips net buys while OI turns bullish, then I’ll go long and admit I was wrong. Until then, any bounce is just handing flesh to the shorts.
#bnb $BNB
Most striking is the spot taker activity near the close: the sell volume is nearly ten times the buy volume (18.154 vs 1.818). In about 100 trades, it was almost one-sided—dumping directly into the bid. Meanwhile, in the open interest position distribution across four quadrants, everything is concentrated in bear_strong; as price falls, OI is still pushing higher—bulls are trapped above the 719 top, and the liquidation wave could ignite at any moment.
On the funding side, it’s also reversing: whale leveraged positions were cut by 1.99% over 7 hours; on-chain lending dropped sharply 38.5% within 12 hours; and the funding rate flipped from positive pressure back to 0. Even if there are 12 consecutive green spot candles within 3 hours, that’s still “buying at the top” and becoming trapped liquidity—it’s not new demand.
I’ll say it plainly: short. 699-704 is the entry zone. First target is 690—the yesterday low. If that breaks, look for 677 (the 3-day low). Stop loss is above 720. This isn’t guaranteed to fall—it’s just that the odds are bearish: three things line up at once—overbought, trapped longs, and a retreat in capital.
Conditions for a reversal: if price regains volume and holds above 719.8, and the spot taker flips net buys while OI turns bullish, then I’ll go long and admit I was wrong. Until then, any bounce is just handing flesh to the shorts.
#bnb $BNB