$ETH Crypto Circle Academician: 8.26 Ethereum (ETH) long momentum released in full—watch out for a deep pullback in the next round of ETH? Latest market analysis reference
At the current price of 2475, this rally directly breaks the previous long-term range-bound pattern. After missing the move, many friends feel torn inside: if they chase higher, they’re afraid they’ll be buying right at the top; if they don’t, they fear the price will keep climbing and they’ll miss the big opportunity. The market is always like this—when it rises, greed and fear tug at people’s mindset at the same time. Many see a strong bullish candle and rush in impulsively; then after a pullback, they get stuck in losses. The people who truly hold onto their profits are always the ones who make a plan
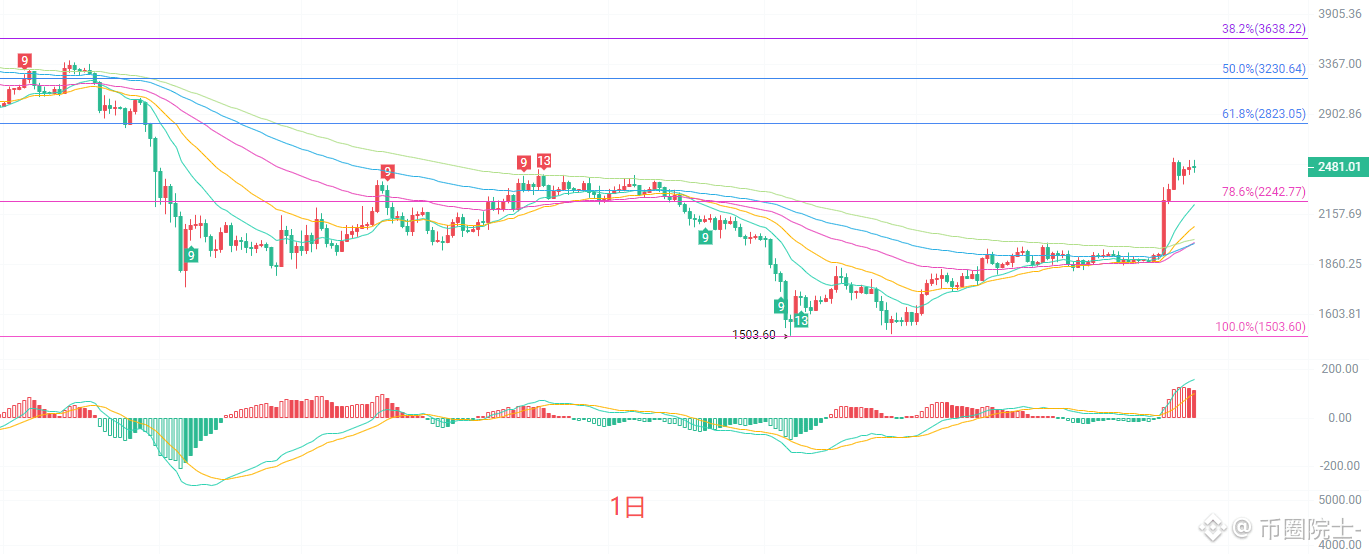
The daily K-line has already broken above the 78.6% Fibonacci level at 2242.77, opening up upward movement space. The price has closed above the full EMA moving-average system; all medium- and long-term moving averages have turned upward, confirming the uptrend. The Bollinger Bands are opening upward, with the K-line trading near the upper band. The MACD keeps high-level red histogram expansion, and bullish momentum remains sufficient. However, after consecutive big bullish candles, the chart has accumulated a large amount of profit-taking. In the short term, there is a need for a pullback to digest gains. The first resistance above is around 2823. The key support below is 2242. As long as the daily chart does not break that support, the large-scale bullish structure will not be easily broken. Be cautious of a “rally-into-pullback” type of shakeout
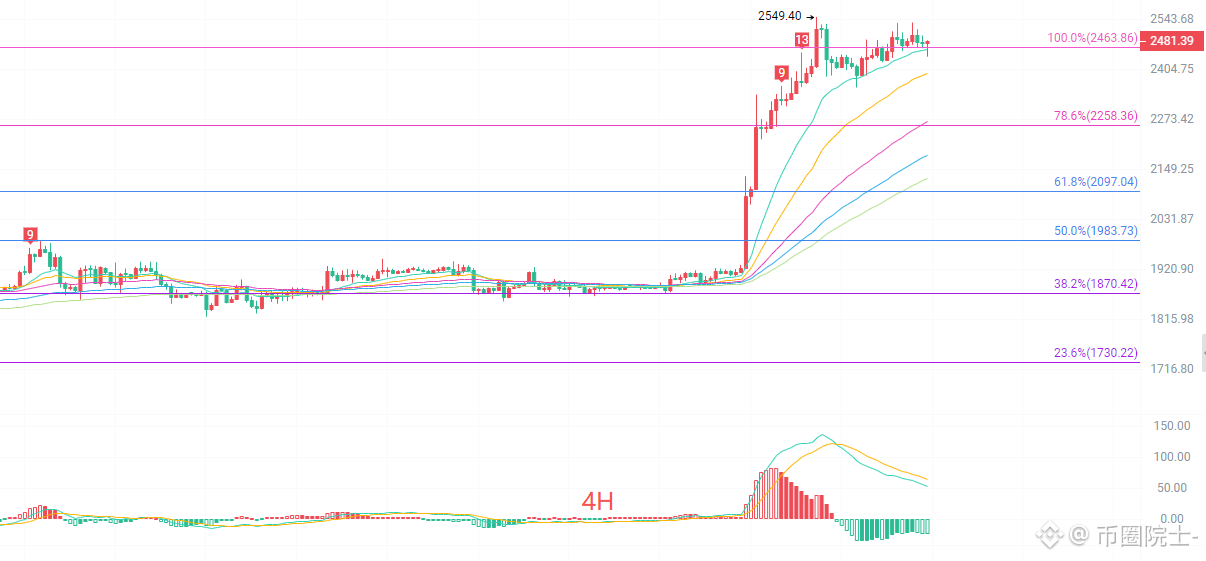
The 4-hour K-line has started showing small-scale pullback signals. Price still runs inside the upper Bollinger Band, and the short-term EMA moving averages are still in a strong bullish alignment. But the MACD shows signs of a bearish divergence; the red histogram keeps shrinking, and green bearish bars begin to appear—indicating that short-term bullish momentum has started to weaken. The 100% Fibonacci level at 2463.86 has been tested repeatedly. That level has shifted from support to a battleground between bulls and bears. There is a need for a pullback in the short cycle. Pay close attention to moving-average support around 2258. If that level holds, after the pullback there should still be a chance for a second push higher. If there is an effective breakdown, this round of short-term upward move will enter a deep correction
Short-term reference:
From 2460 down to 2420: if it does not break northbound, place a stop-loss 40 points; targets are 2550 to 2600
From 2550 up to 2600: if it does not break southbound, place a stop-loss 40 points; targets are 2500 to 2450
Specific execution should be based primarily on real-time order-book data. For more information, you can consult the author; the article may be published with a delay. The above is for reference only—risk is your own
#ETH走势分析
At the current price of 2475, this rally directly breaks the previous long-term range-bound pattern. After missing the move, many friends feel torn inside: if they chase higher, they’re afraid they’ll be buying right at the top; if they don’t, they fear the price will keep climbing and they’ll miss the big opportunity. The market is always like this—when it rises, greed and fear tug at people’s mindset at the same time. Many see a strong bullish candle and rush in impulsively; then after a pullback, they get stuck in losses. The people who truly hold onto their profits are always the ones who make a plan
The daily K-line has already broken above the 78.6% Fibonacci level at 2242.77, opening up upward movement space. The price has closed above the full EMA moving-average system; all medium- and long-term moving averages have turned upward, confirming the uptrend. The Bollinger Bands are opening upward, with the K-line trading near the upper band. The MACD keeps high-level red histogram expansion, and bullish momentum remains sufficient. However, after consecutive big bullish candles, the chart has accumulated a large amount of profit-taking. In the short term, there is a need for a pullback to digest gains. The first resistance above is around 2823. The key support below is 2242. As long as the daily chart does not break that support, the large-scale bullish structure will not be easily broken. Be cautious of a “rally-into-pullback” type of shakeout
The 4-hour K-line has started showing small-scale pullback signals. Price still runs inside the upper Bollinger Band, and the short-term EMA moving averages are still in a strong bullish alignment. But the MACD shows signs of a bearish divergence; the red histogram keeps shrinking, and green bearish bars begin to appear—indicating that short-term bullish momentum has started to weaken. The 100% Fibonacci level at 2463.86 has been tested repeatedly. That level has shifted from support to a battleground between bulls and bears. There is a need for a pullback in the short cycle. Pay close attention to moving-average support around 2258. If that level holds, after the pullback there should still be a chance for a second push higher. If there is an effective breakdown, this round of short-term upward move will enter a deep correction
Short-term reference:
From 2460 down to 2420: if it does not break northbound, place a stop-loss 40 points; targets are 2550 to 2600
From 2550 up to 2600: if it does not break southbound, place a stop-loss 40 points; targets are 2500 to 2450
Specific execution should be based primarily on real-time order-book data. For more information, you can consult the author; the article may be published with a delay. The above is for reference only—risk is your own
#ETH走势分析