$BTC Coin Circle Academics: 8.26 Bitcoin (BTC) surges—don’t chase longs blindly. Read the K-line signals to seize the BTC offense-defense rhythm? Latest market analysis and trading suggestions
Bitcoin’s current price is 79,200. A fresh surge pushed it straight up to around 81,300. Many friends are now conflicted: should you chase longs and enter now, or wait for a pullback to set up? The board is blazing hot—those who missed the move feel anxious, while those holding long positions worry about a spike-and-drop, fearing profit retracement. The market is always like this after a big rally: sentiment splits into two extremes. One group believes a new leg of the main upswing has begun and looks for even higher prices; the other group thinks the move is too large and a deep pullback could come at any moment.
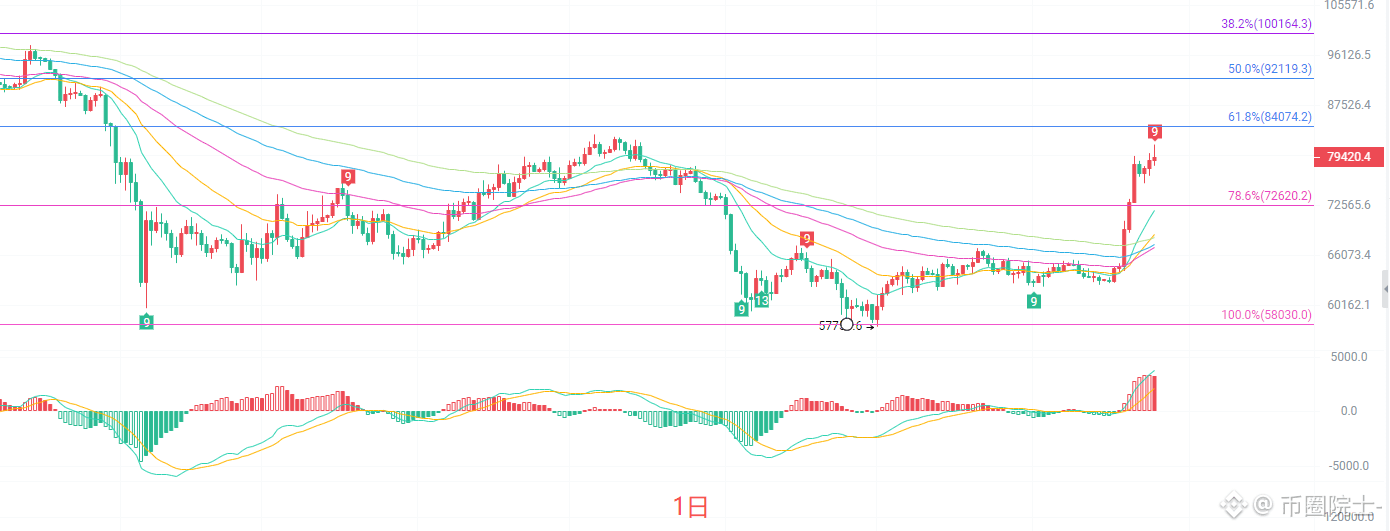
The daily K-line shows a strong rebound. Price has effectively climbed above multiple EMA moving averages; the moving-average system has fully turned upward, forming a bullish alignment. The MACD indicator’s DIF and DEA both turn upward together; the red histogram continues to expand, and bullish momentum remains strong. The Bollinger Bands open upward, and price is trading near the upper band. A key resistance overhead is 81,270, the previous swing high. If there is a valid breakout, more upside room will open. The first support below is at 72,620, the 78.6% Fibonacci level. On the daily chart, the bigger trend favors bulls. However, after consecutive technical gains in the short term, there may be a technical pullback for repair. It’s not excluded that after a spike, price will pull back to confirm support at the moving averages. Don’t chase at any price—waiting for a pullback opportunity is more prudent.
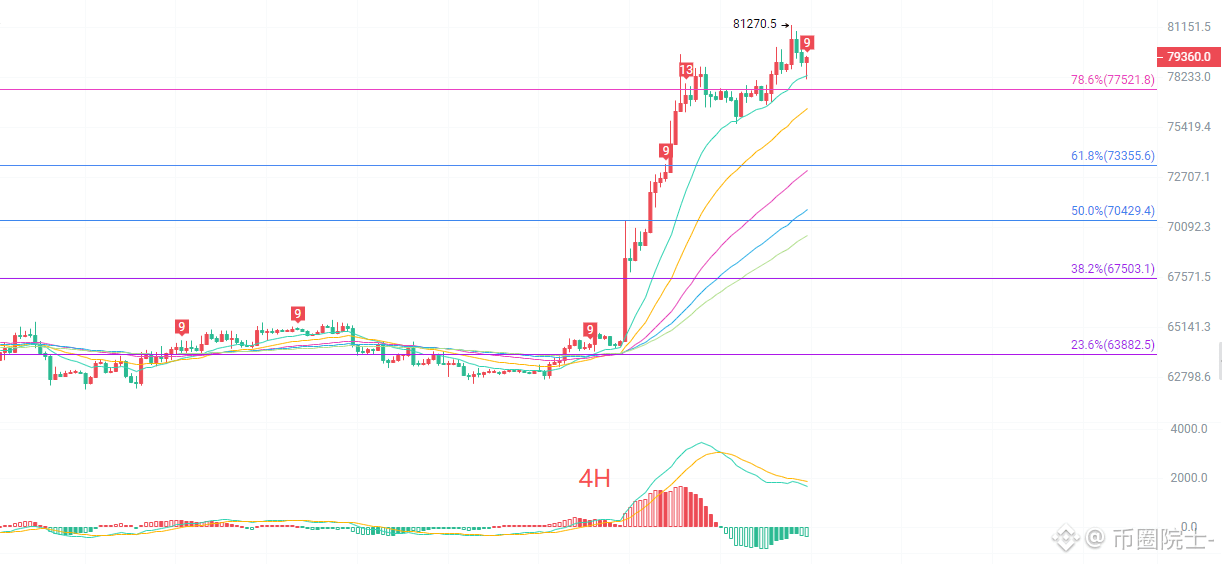
On the four-hour chart, BTC is currently in a high-range consolidation phase, digesting the move. The short-term EMA moving averages are still dispersing upward, and the moving averages form a strong support. The larger structure bullish trend has not been broken. The MACD red histogram is gradually shrinking; DIF shows signs of turning downward, and there are early warnings of a bearish divergence (top-back-divergence), suggesting that short-term bullish momentum is weakening. The Bollinger Bands channel is still pointing upward, but price has fallen from near the upper band toward the middle band. Resistance is 81,270; the first support below is 77,521 at the 78.6% Fibonacci level. The 4-hour timeframe needs room for a pullback and buildup. Most likely, price won’t just rocket straight up; instead, it will shake and pull back to flush out excess positions before choosing its next direction.
Short-term reference:
From 77,500 down to 77,000 (northbound pullback setup), stop loss 76,200, target 82,000 to 85,000.
From 81,000 up to 81,500 (southbound pullback setup), stop loss 82,600, target 77,500 to 74,000.
#BTC走势分析
Bitcoin’s current price is 79,200. A fresh surge pushed it straight up to around 81,300. Many friends are now conflicted: should you chase longs and enter now, or wait for a pullback to set up? The board is blazing hot—those who missed the move feel anxious, while those holding long positions worry about a spike-and-drop, fearing profit retracement. The market is always like this after a big rally: sentiment splits into two extremes. One group believes a new leg of the main upswing has begun and looks for even higher prices; the other group thinks the move is too large and a deep pullback could come at any moment.
The daily K-line shows a strong rebound. Price has effectively climbed above multiple EMA moving averages; the moving-average system has fully turned upward, forming a bullish alignment. The MACD indicator’s DIF and DEA both turn upward together; the red histogram continues to expand, and bullish momentum remains strong. The Bollinger Bands open upward, and price is trading near the upper band. A key resistance overhead is 81,270, the previous swing high. If there is a valid breakout, more upside room will open. The first support below is at 72,620, the 78.6% Fibonacci level. On the daily chart, the bigger trend favors bulls. However, after consecutive technical gains in the short term, there may be a technical pullback for repair. It’s not excluded that after a spike, price will pull back to confirm support at the moving averages. Don’t chase at any price—waiting for a pullback opportunity is more prudent.
On the four-hour chart, BTC is currently in a high-range consolidation phase, digesting the move. The short-term EMA moving averages are still dispersing upward, and the moving averages form a strong support. The larger structure bullish trend has not been broken. The MACD red histogram is gradually shrinking; DIF shows signs of turning downward, and there are early warnings of a bearish divergence (top-back-divergence), suggesting that short-term bullish momentum is weakening. The Bollinger Bands channel is still pointing upward, but price has fallen from near the upper band toward the middle band. Resistance is 81,270; the first support below is 77,521 at the 78.6% Fibonacci level. The 4-hour timeframe needs room for a pullback and buildup. Most likely, price won’t just rocket straight up; instead, it will shake and pull back to flush out excess positions before choosing its next direction.
Short-term reference:
From 77,500 down to 77,000 (northbound pullback setup), stop loss 76,200, target 82,000 to 85,000.
From 81,000 up to 81,500 (southbound pullback setup), stop loss 82,600, target 77,500 to 74,000.
#BTC走势分析