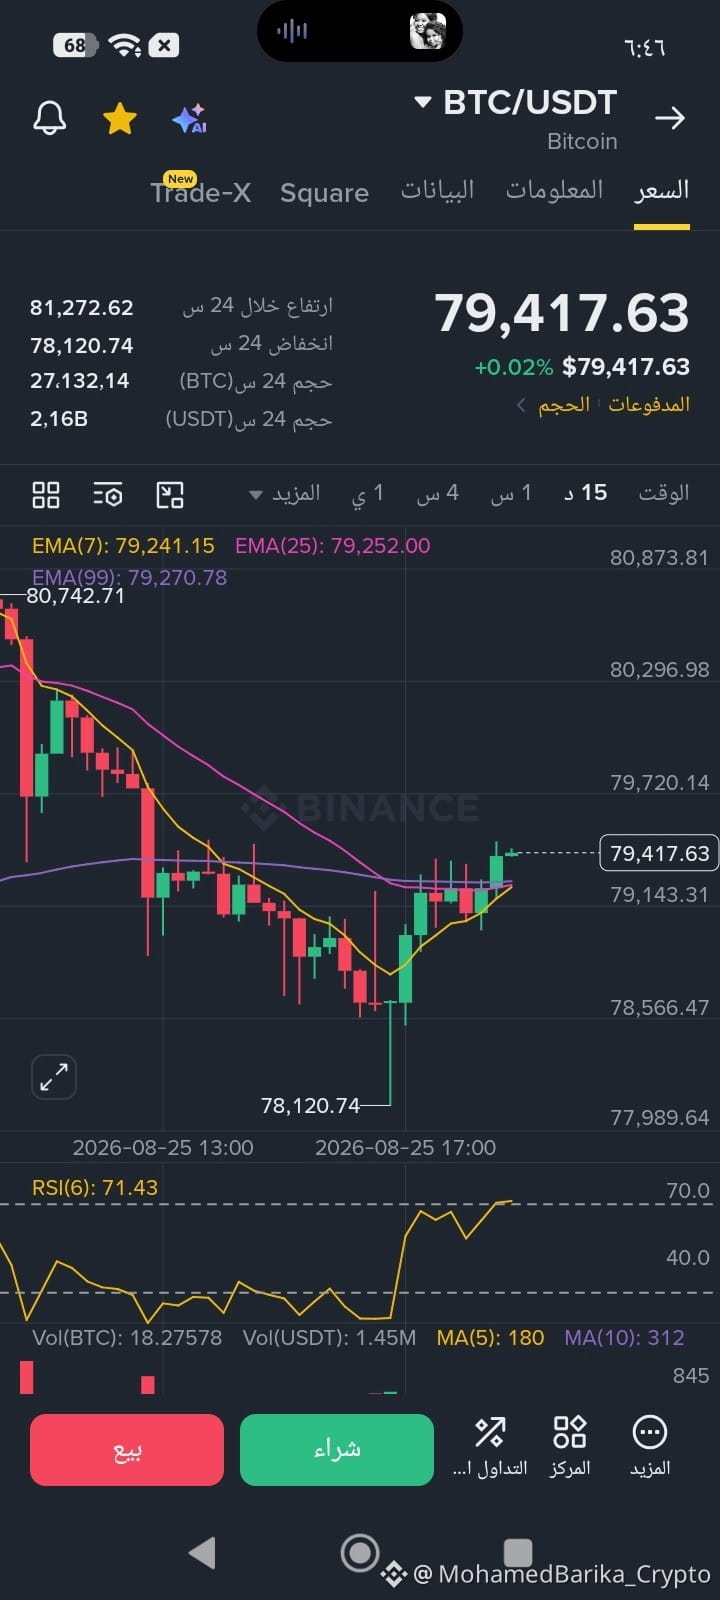
$BTC Everyone focuses on the 15-minute frame for BTC/USDT, confirming the continuation of bullish momentum, the strength of the rebound, and price stability above the moving averages after testing the 78,120.74$ bottom! 🚀
LONG 🟢 - BTC$
Trading Plan:
Entry: 78,900 – 79,417.63
SL (Stop Loss): 78,000
TP1: 80,200
TP2: 80,850
TP3: 81,500
Why this setup?
Price is testing strong levels at 79,417.63$ amid notable activity and trading volume of nearly $2.16 billion, reflecting buyers’ dominance and their support for the uptrend following the quick rebound from the bottom.
The RSI indicator (on the 15D timeframe) is at 71.43, showing strong buying control and upward momentum that supports continuing the rise toward nearby resistance levels.
The moving averages (EMA) crossover is nearing positivity, with EMA(7) moving at 79,241.15, supporting the continuation of short-term bullish momentum.
Why now?
The current entry zone represents an excellent consolidation opportunity to capture the new upswing wave and break through the 80,000$ levels strongly.
Discussion:
Will Bitcoin succeed in breaking above the 80,873$ barrier and continue higher, or will we see a retest of the lower levels? Who’s with us on this trade?
Click here to trade 👇🙂
$AAPLB $AAPL.US #ZECBreaksKeyResistanceUp75.5% #OilHoldsLosses #SamsungSKHynixLeveragedETFsPostFirstMonthlyOutflow #KazakhstanCutsOilOutputForecastTo96MTons #HKJulyGoldNetExportsToMainland56.193Tons
LONG 🟢 - BTC$
Trading Plan:
Entry: 78,900 – 79,417.63
SL (Stop Loss): 78,000
TP1: 80,200
TP2: 80,850
TP3: 81,500
Why this setup?
Price is testing strong levels at 79,417.63$ amid notable activity and trading volume of nearly $2.16 billion, reflecting buyers’ dominance and their support for the uptrend following the quick rebound from the bottom.
The RSI indicator (on the 15D timeframe) is at 71.43, showing strong buying control and upward momentum that supports continuing the rise toward nearby resistance levels.
The moving averages (EMA) crossover is nearing positivity, with EMA(7) moving at 79,241.15, supporting the continuation of short-term bullish momentum.
Why now?
The current entry zone represents an excellent consolidation opportunity to capture the new upswing wave and break through the 80,000$ levels strongly.
Discussion:
Will Bitcoin succeed in breaking above the 80,873$ barrier and continue higher, or will we see a retest of the lower levels? Who’s with us on this trade?
Click here to trade 👇🙂
$AAPLB $AAPL.US #ZECBreaksKeyResistanceUp75.5% #OilHoldsLosses #SamsungSKHynixLeveragedETFsPostFirstMonthlyOutflow #KazakhstanCutsOilOutputForecastTo96MTons #HKJulyGoldNetExportsToMainland56.193Tons