

Written by: Alex Thorn, Head of Research at Galaxy Digital
Compiled by: Glendon, Techub News
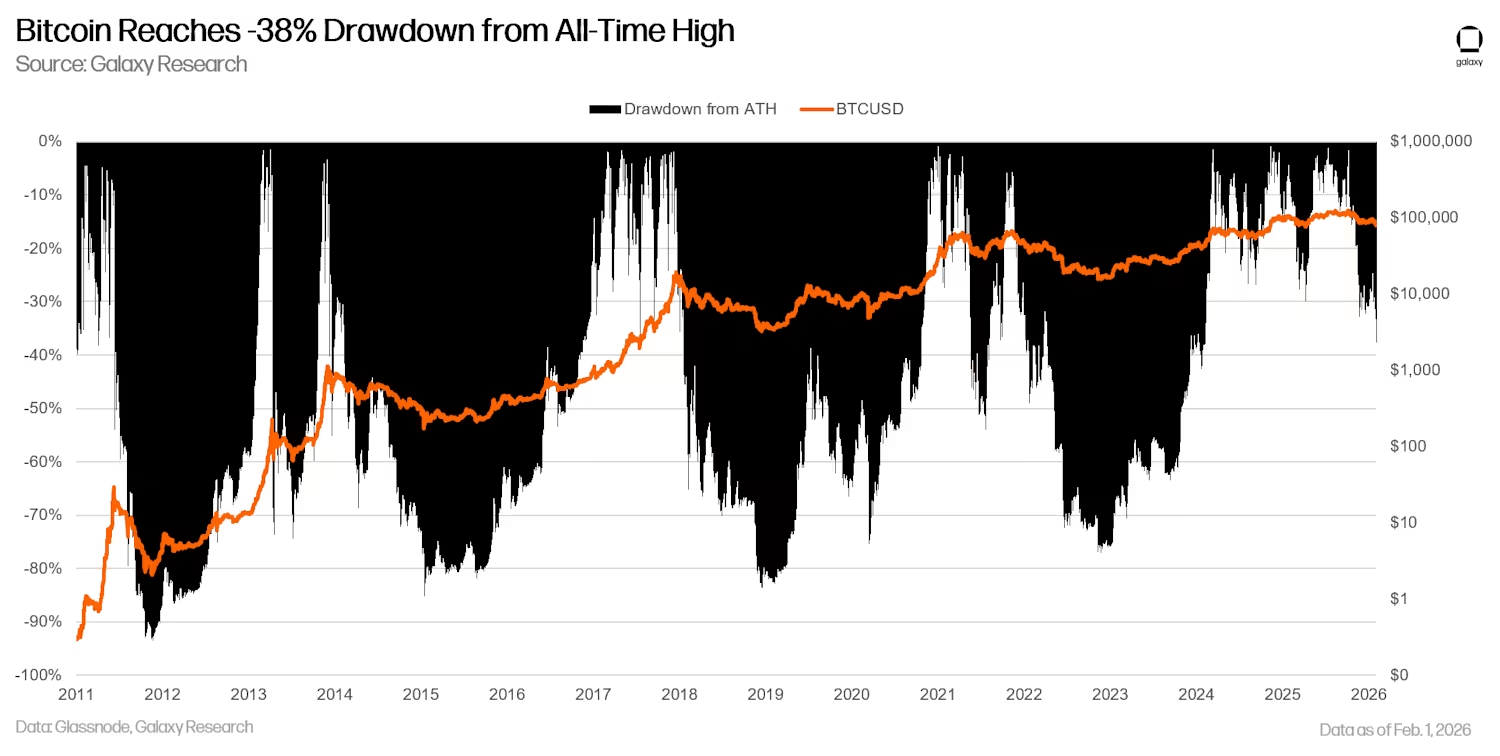
From January 28 to January 31, Bitcoin experienced a significant drop of 15%, with the decline worsening over the weekend. On Saturday alone, Bitcoin plummeted by 10%, triggering one of the largest liquidation events in the history of futures trading platforms, with long positions liquidated exceeding $2 billion. Meanwhile, on Saturday, Bitcoin's price on Coinbase briefly fell to $75,644, more than a 10% drop compared to the average cost basis of $84,000 for U.S. ETFs. Additionally, Bitcoin's price also dropped below the average cost price of $76,037 for Strategy, nearing a one-year low of $74,420 (this low was set during the 'Tariff Storm' in April 2025). Currently, 46% of the Bitcoin supply in the market is in a state of loss, meaning these Bitcoins were transferred on-chain at prices higher than the current price. By the close on Saturday evening, Bitcoin saw its first occurrence of four consecutive months of decline since 2018.
From historical data, except for 2017, Bitcoin has never experienced a situation where it dropped nearly 40% from its historical high and did not expand to over 50% within three months (if it drops 50% from the current historical high, Bitcoin price would fall to $63,000). There is a significant gap in on-chain holdings between $82,000 and $70,000, increasing the likelihood of Bitcoin testing demand in that range in the short term. The current realized price of Bitcoin is about $56,000, and the 200-week moving average is about $58,000 (notably, when the BTCUSD trading price is above these indicators, these indicators rise daily).
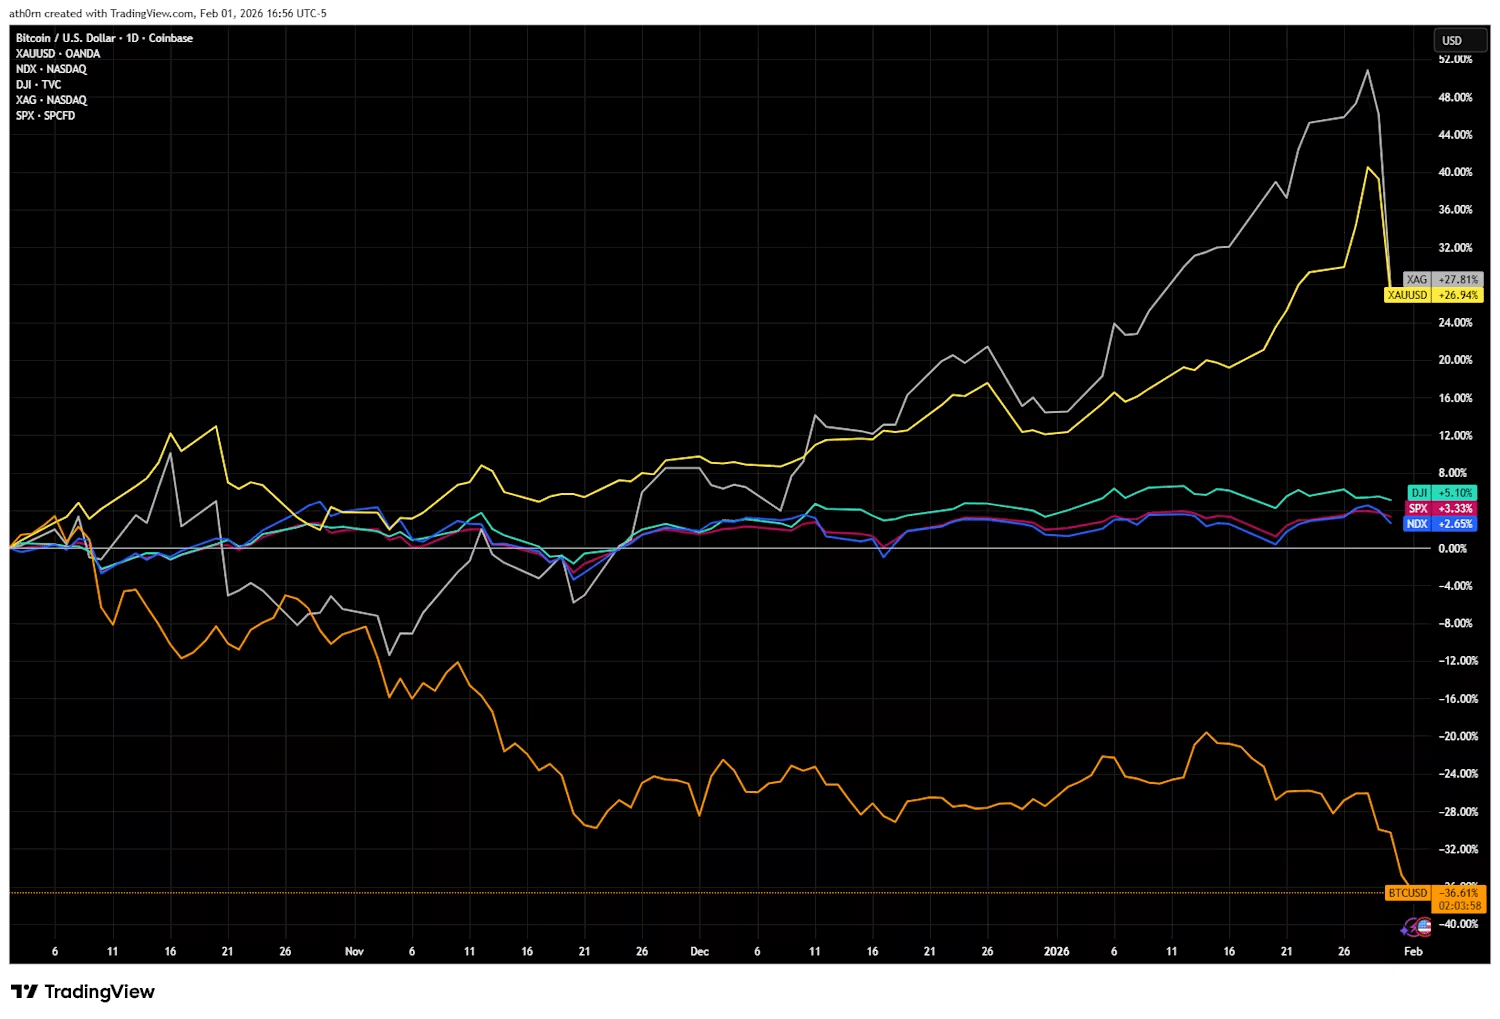
Currently, there are few signs of large whales or long-term holders significantly increasing their holdings of Bitcoin, but the profit-taking behavior of long-term holders has begun to noticeably decrease. The market lacks effective 'catalysts', and the narrative is also unfavorable to Bitcoin. Bitcoin has failed to rise in sync with gold and silver, and has not played a role as part of the overall market 'currency devaluation hedge trade'.
Moreover, the passage of legislation regarding the structure of the cryptocurrency market (the CLARITY Act) may serve as an external catalyst in the short term, but the likelihood of its passage has decreased in recent weeks. Galaxy Digital believes that even if the bill passes, the positive momentum it brings is more likely to benefit altcoins rather than Bitcoin itself.
Although Bitcoin prices may fluctuate around the historically largest discount of 10% (currently about $76,000), considering the above factors, it is highly likely that Bitcoin will retreat to the bottom of the supply gap (around $70,000) and further test the realized price ($56,000) and the 200-week moving average ($58,000) in the coming weeks or months. However, the longer it takes for prices to drop to these indicators, the higher these indicators may rise due to slow price movement, potentially converging above the current values. Historically, these price levels have typically marked cycle bottoms and are good entry points for long-term investors.
Specific Analysis
Bitcoin Retracement Situation
As of the time of writing, Bitcoin's trading price has dropped 38% from its historical high of $126,296 set on October 6, 2025.
Key Price Level Analysis
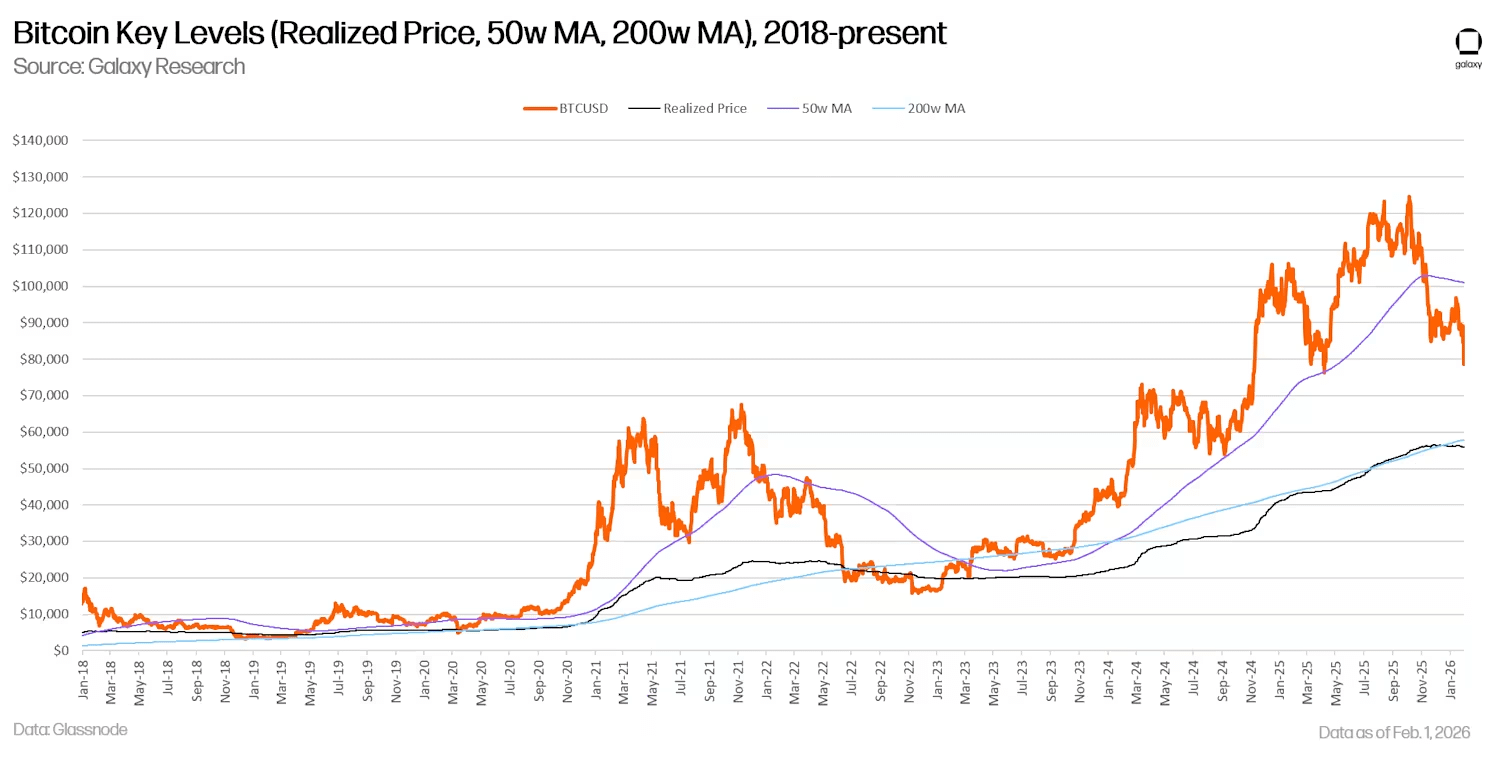
This analysis includes realized price, 50-week moving average, and 200-week moving average. In the past three bull markets (2013/14, 2017/18, 2019/21), the 50-week moving average has acted as a key support level, but once it falls below that average, prices ultimately retreat to near the 200-week moving average. In November 2025, Bitcoin fell below the 50-week moving average, and the current 200-week moving average is located around $58,000.
Similarly, Bitcoin's realized price (an indicator that measures its average cost based on the latest transactions on-chain) is currently around $56,000. At previous bear market bottoms, although Bitcoin trading prices were below the actual price, they usually found support around or slightly below that level, followed by a rally.
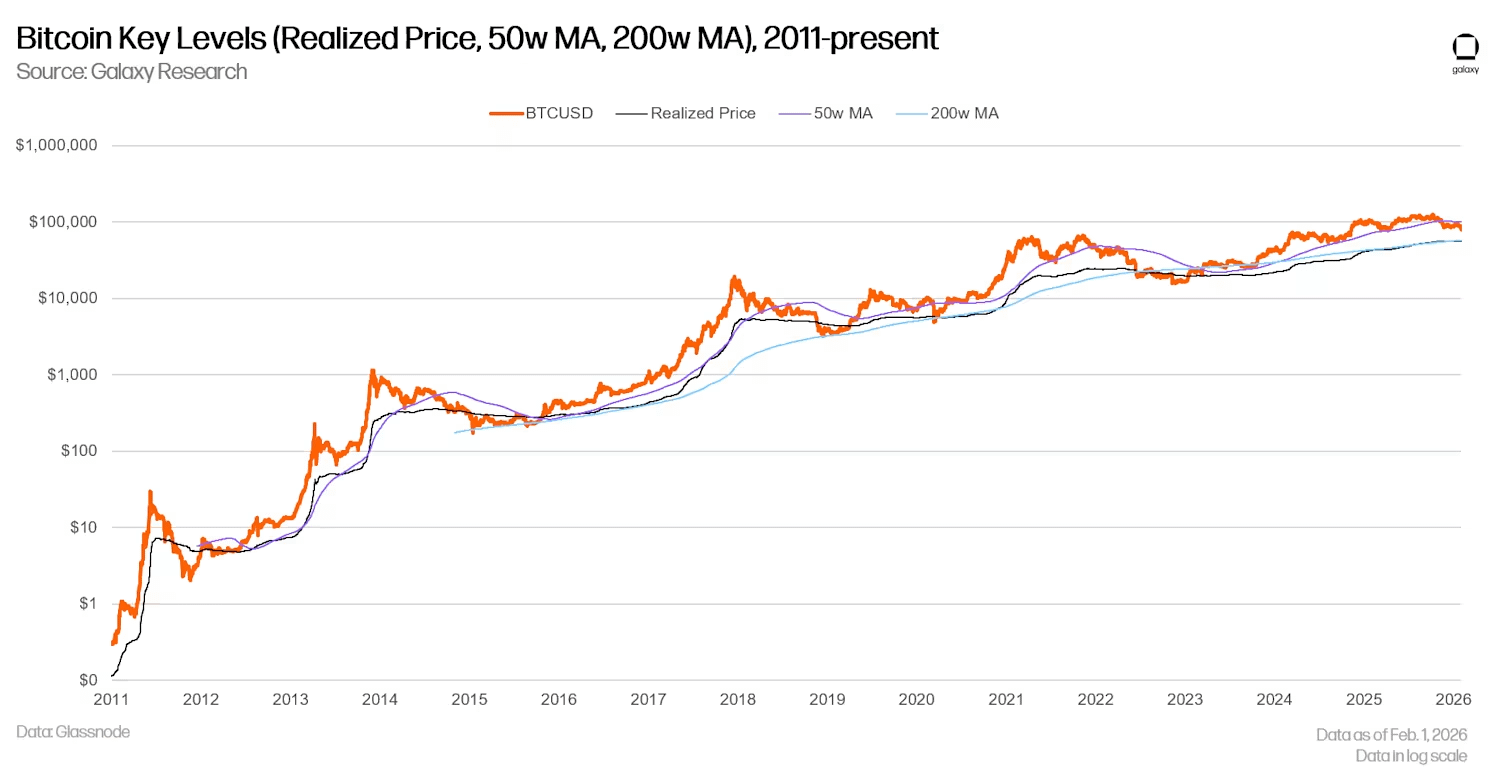
Observing the trend from 2018 to the present with linear coordinates, it can be found that the realized price and the 200-week moving average are converging, both are close to the high range of $58,000.
The Bitcoin ETF inflow cost basis has now fallen below
The U.S. Bitcoin ETF will officially launch in January 2024, opening the market access for a new type of investor. In August 2023, after Grayscale won its lawsuit against the U.S. Securities and Exchange Commission (SEC) in the D.C. Circuit Court, market expectations for the eventual launch of the ETF drove a comprehensive recovery in Bitcoin prices. As of the week of January 30, 2026, the cumulative net inflow of funds into the U.S. Bitcoin ETF reached $54 billion. This figure peaked at $62.2 billion in early October 2025, currently down 12.4% from its historical high. The overall scale remains substantial; although the spot price of Bitcoin has fallen nearly 40% from its historical high, ETF holders still show strong holding resilience.
However, the past two weeks have become a 'dark moment' in the history of Bitcoin ETFs, with a total net outflow of $2.8 billion, marking the second and third worst periods in history. The price fluctuations on January 30 and 31 caused Bitcoin to fall below the ETF average cost basis calculated based on fund inflow prices since the summer of 2024 (approximately $84,000).
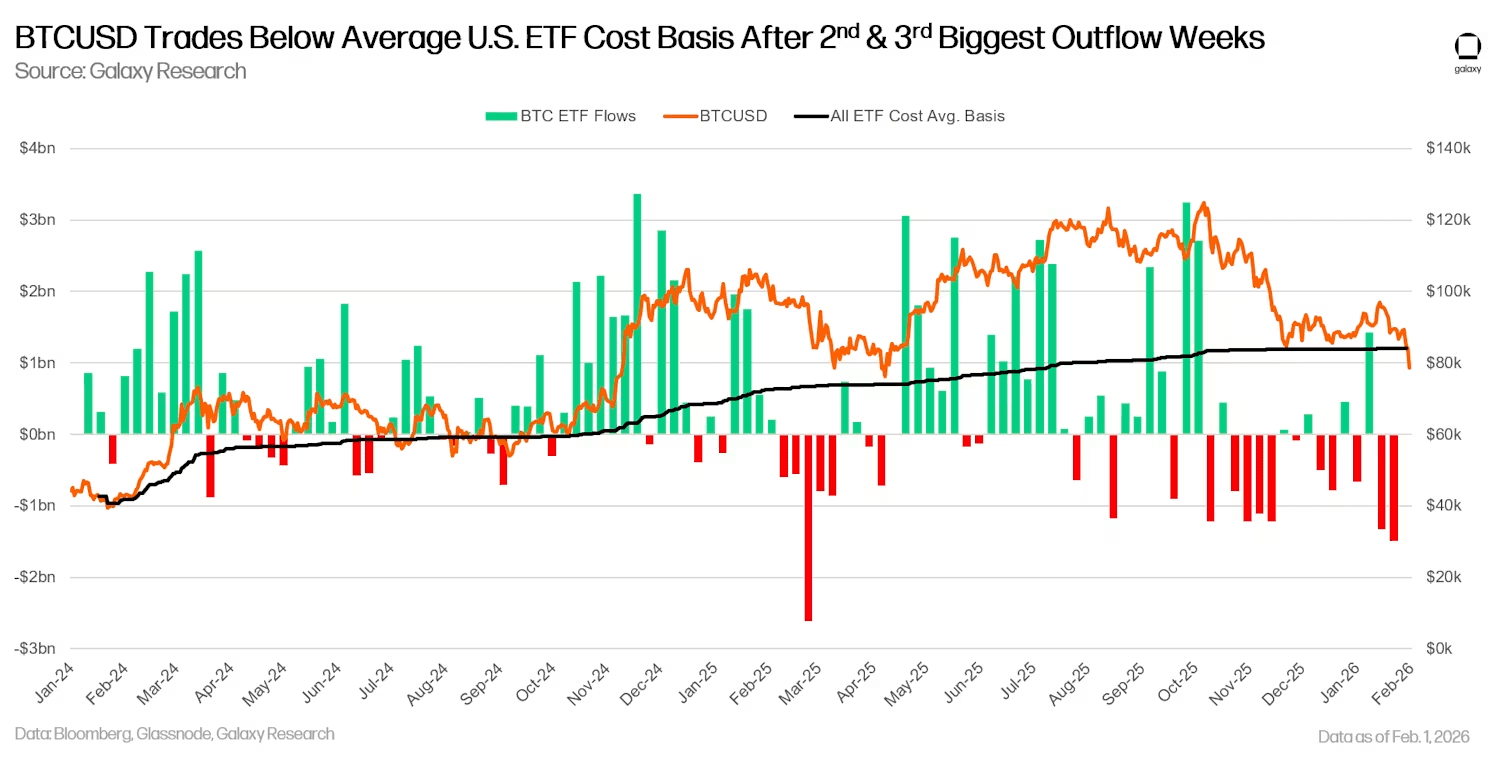
As of the time of writing, Bitcoin's trading price has fallen approximately 7.3% compared to the average cost basis of ETF positions, and on January 31, this decline once expanded to 10%. Since the summer and early autumn of 2024 (when the decline was as low as 9.9%), Bitcoin's trading price has not fallen below the average ETF creation cost price. Therefore, it can be reasonably expected that this level will become a recent support level.
There is a position gap in the range of $70,000 to $80,000.
By observing the supply based on the time of the last on-chain transaction of Bitcoin, it can be found that there is a significant position gap in the price range of $70,000 to $80,000. Notably, the chart shows that approximately 194,000 Bitcoins last traded in the range of $77,000 to $79,500, with the vast majority of transactions occurring within the last two days.
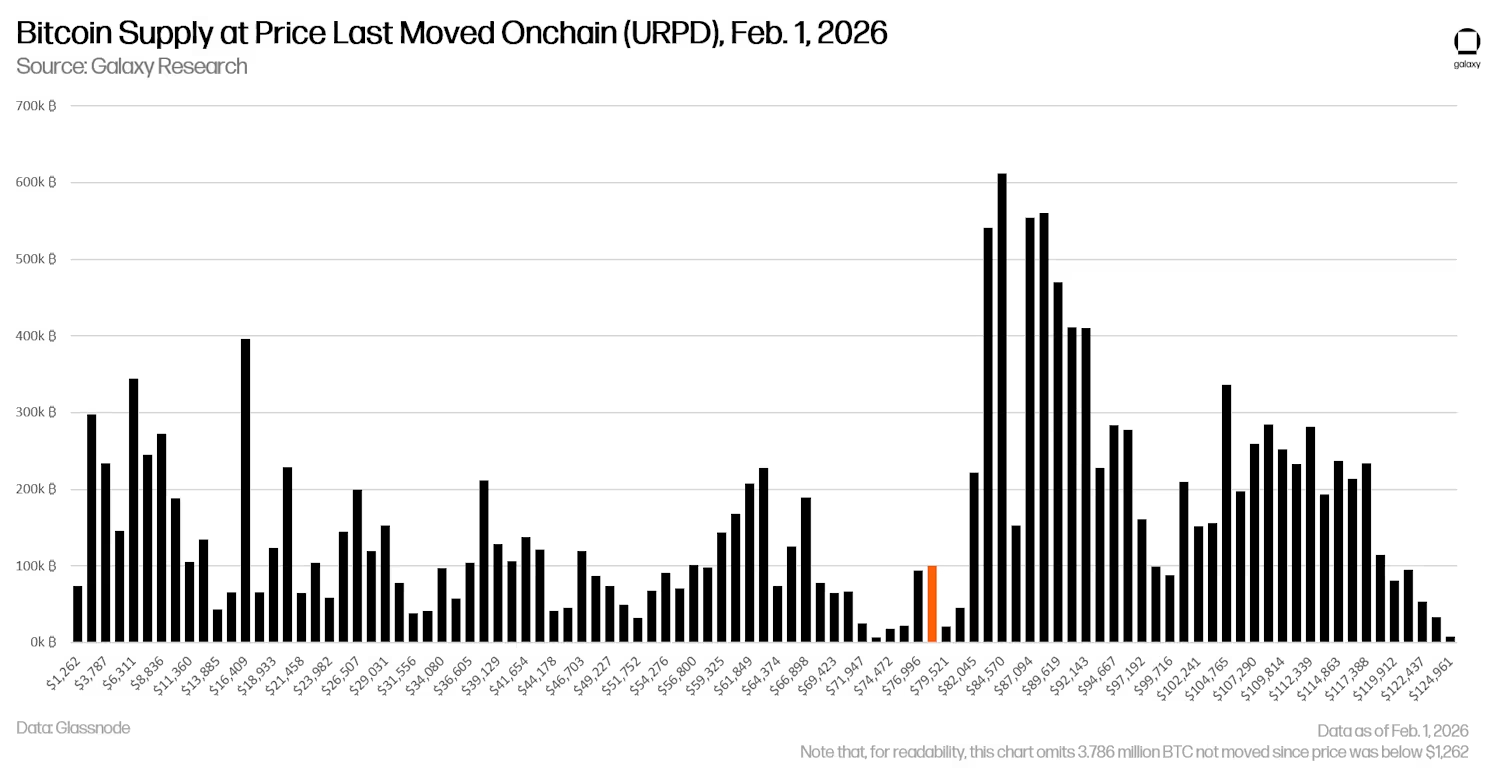
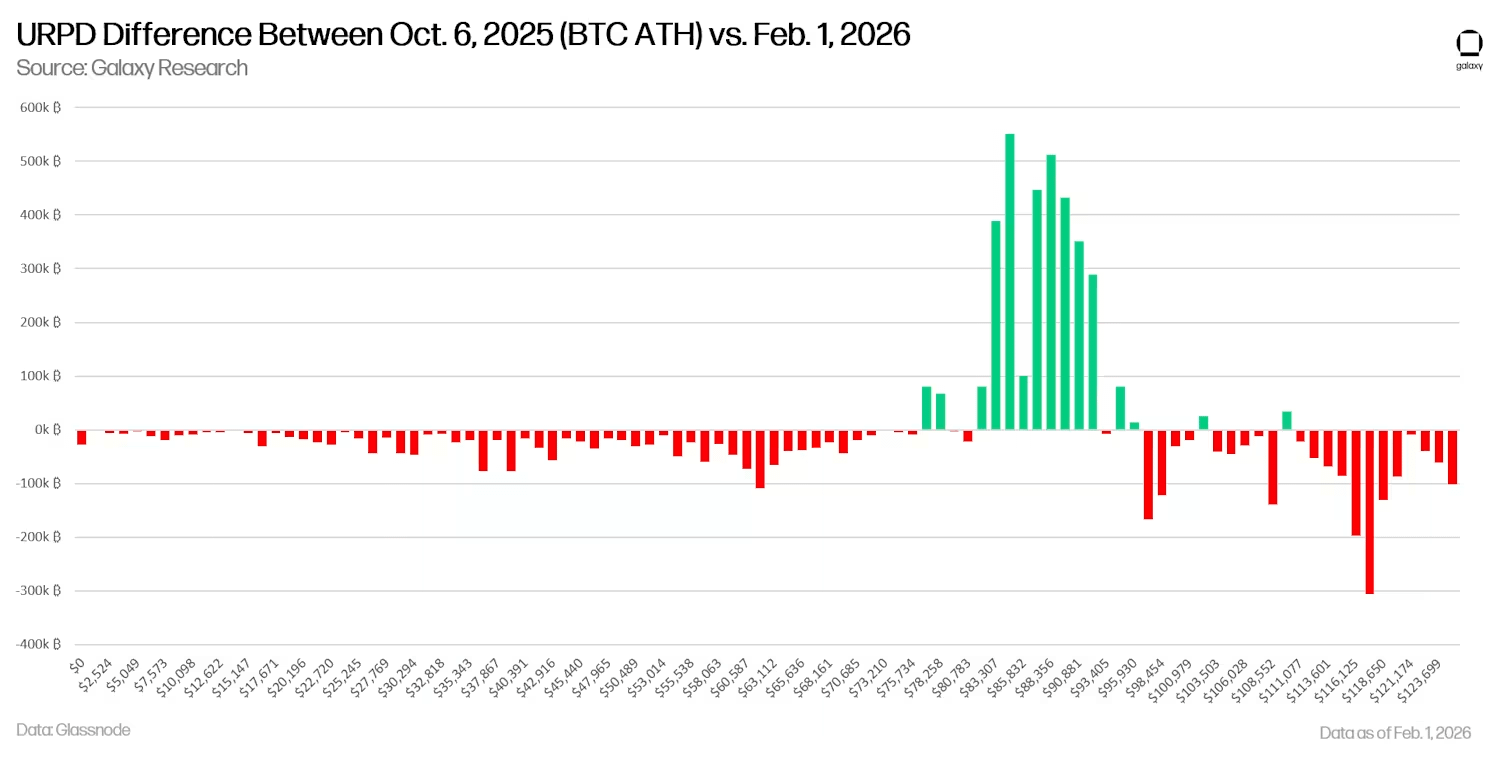
Comparing the data as of February 1, 2026 (URPD) with previous historical high date can provide insights into the source of the selling pressure since October 6 of last year. Over the past four months, there has been a significant amount of buying activity in the price range of $80,000 to $92,000, but other price ranges have intensified selling pressure, with the largest portion coming from investors who bought at prices above $111,000. (Note that URPD is used to measure token price fluctuations and provides heuristic reference for analyzing token buy/sell situations in this article.)
Holder Profit and Loss: Nearly Half Are at a Loss
Currently, 56% of Bitcoin supply is in profit, while 46% is in loss. Historically, all bear market bottoms have shown a convergence of these two indicators approaching a 50-50 ratio, although the loss ratio in 2015 and 2018 once exceeded 60%. From historical data, when the profit to loss ratio approaches equilibrium, it typically signals the formation of a bottom that may last for several months or even an entire cycle.
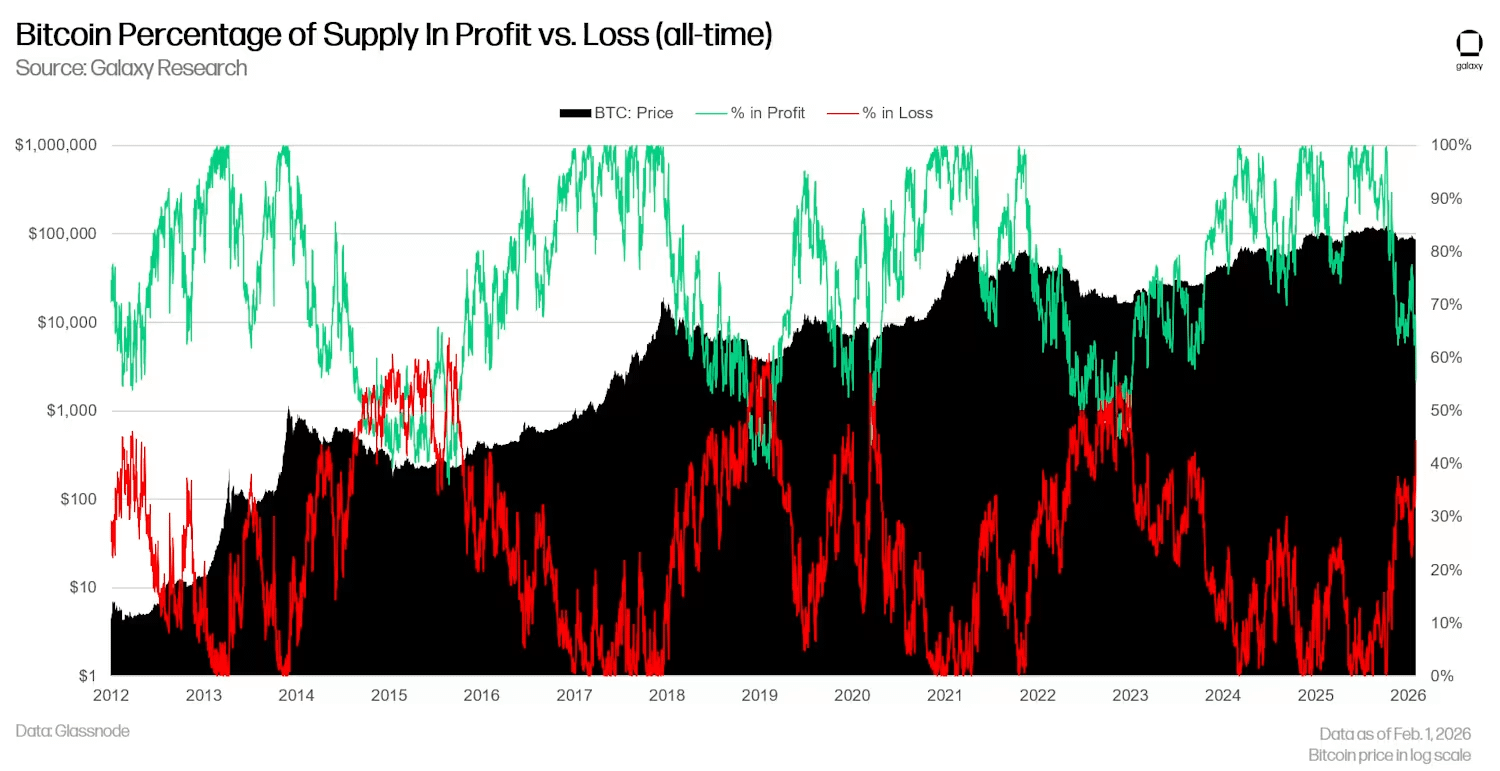
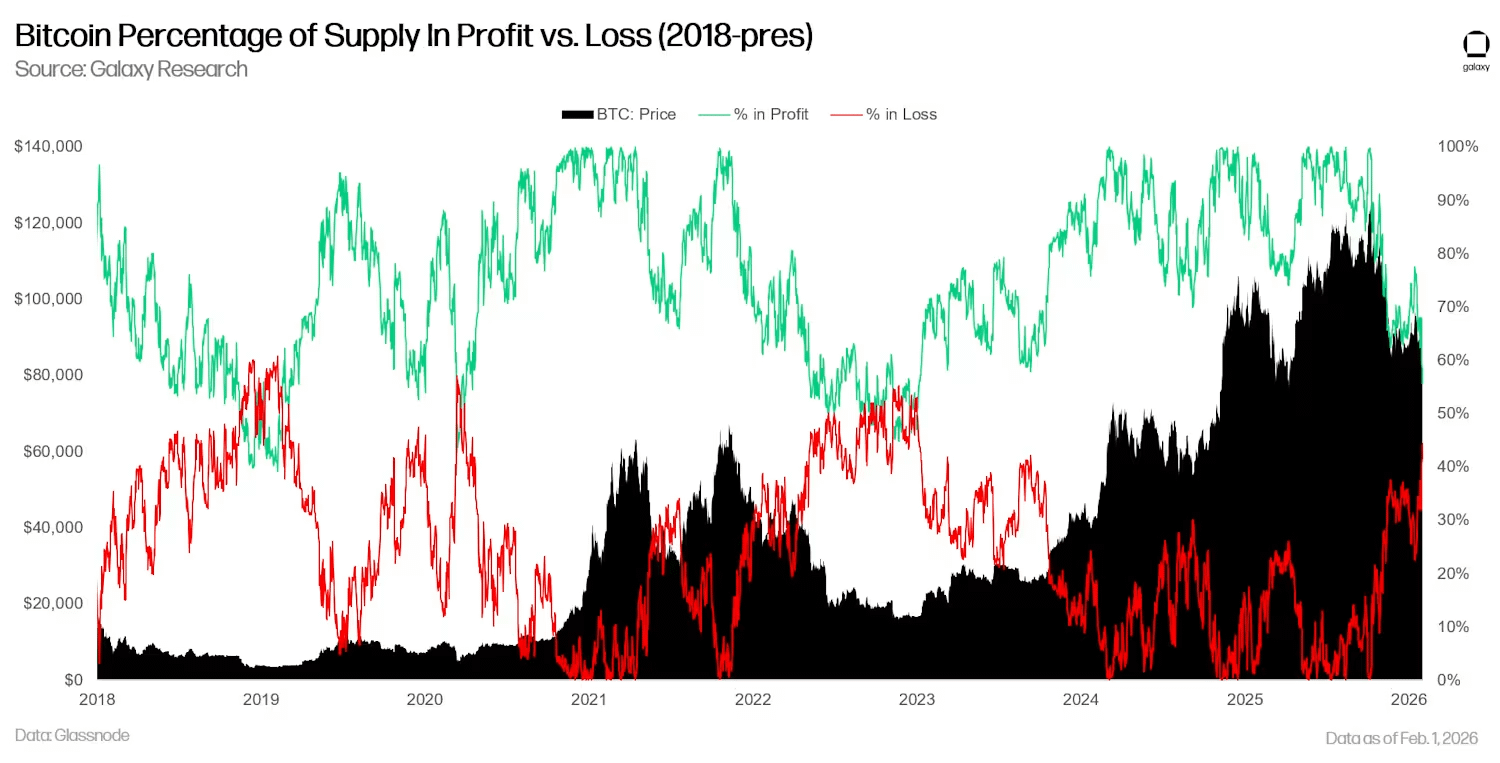
Expanding the time span to 2018 to the present and observing with linear coordinates provides a clearer view of the structural position of the current indicator.
Bitcoin has failed to serve as a hedge against currency devaluation, and its safe-haven function has become ineffective.
Since the fourth quarter of 2025, Bitcoin has underperformed relative to gold, silver, and other metals, a phenomenon widely reported by various financial media. Macroeconomic and geopolitical uncertainties triggered by tariff policies and the reshaping of the global order, combined with concerns over global sovereign debt conditions, have driven investors to flock to commodities and commodity currencies. In such a turbulent environment, Bitcoin's characteristics as a non-sovereign currency and permissionless transactions should have become its fundamental advantages, yet the reality is that Bitcoin's price has declined while traditional safe-haven assets (such as gold) have continued to rise. In a macroeconomic situation that should have favored Bitcoin, its weak performance has damaged its market prospects and shifted investors' attention to other assets.
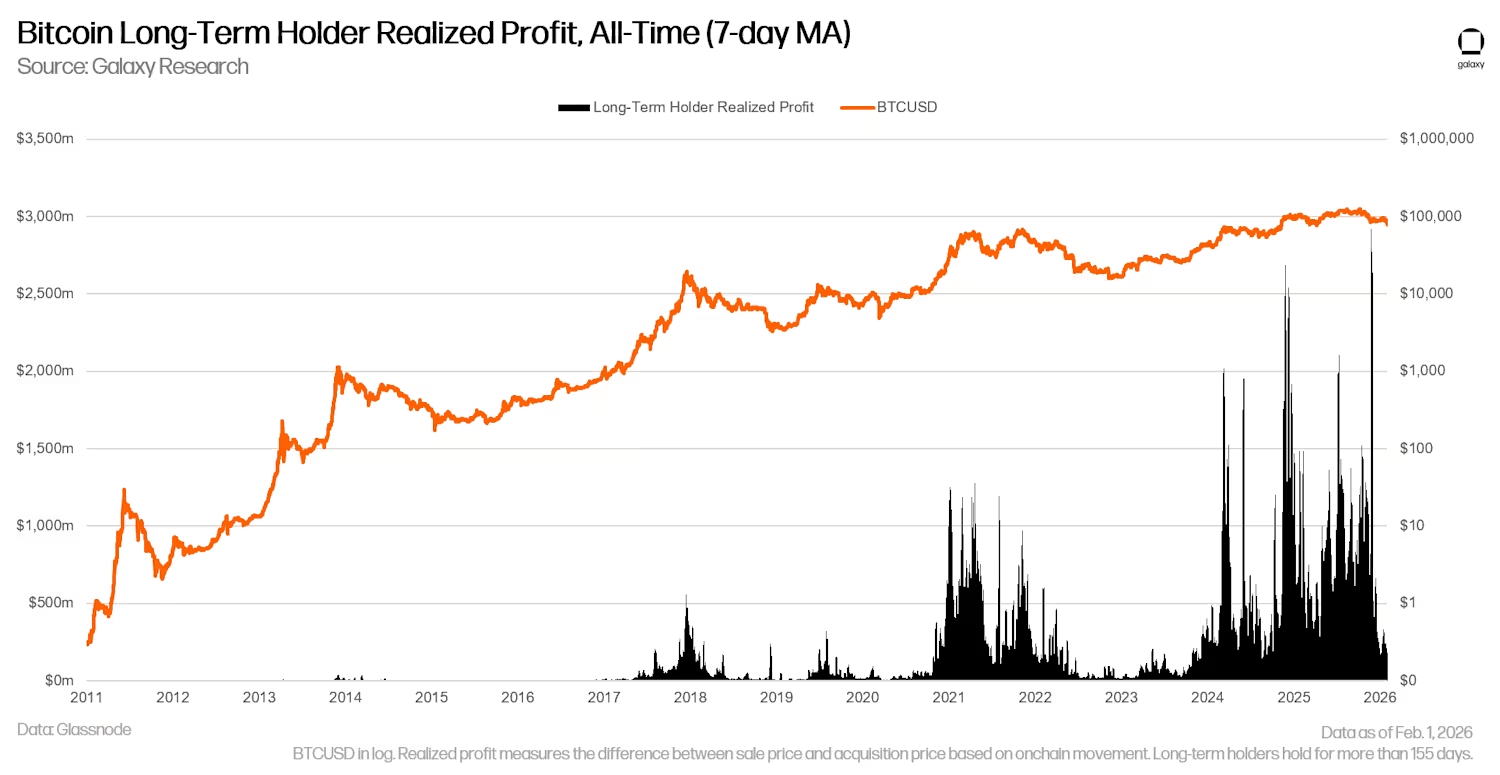
The profit-taking behavior of long-term Bitcoin holders has significantly slowed down
In 2024 and 2025, the scale of profit-taking by long-term holders of Bitcoin (in USD) has exceeded any other period in Bitcoin's history, with the average daily profit-taking amount in 2025 reaching $500 million. Although this selling tide has eventually eased, there may still be more long-term holders waiting to sell at higher prices. Further selling by long-term holders in the future may still pose resistance to price increases. However, the recent significant decline in realized profit-taking by long-term holders is noteworthy, indicating that the market may be approaching a cycle bottom (the chart below shows the profit-taking situation of long-term holders and its 7-day moving average).
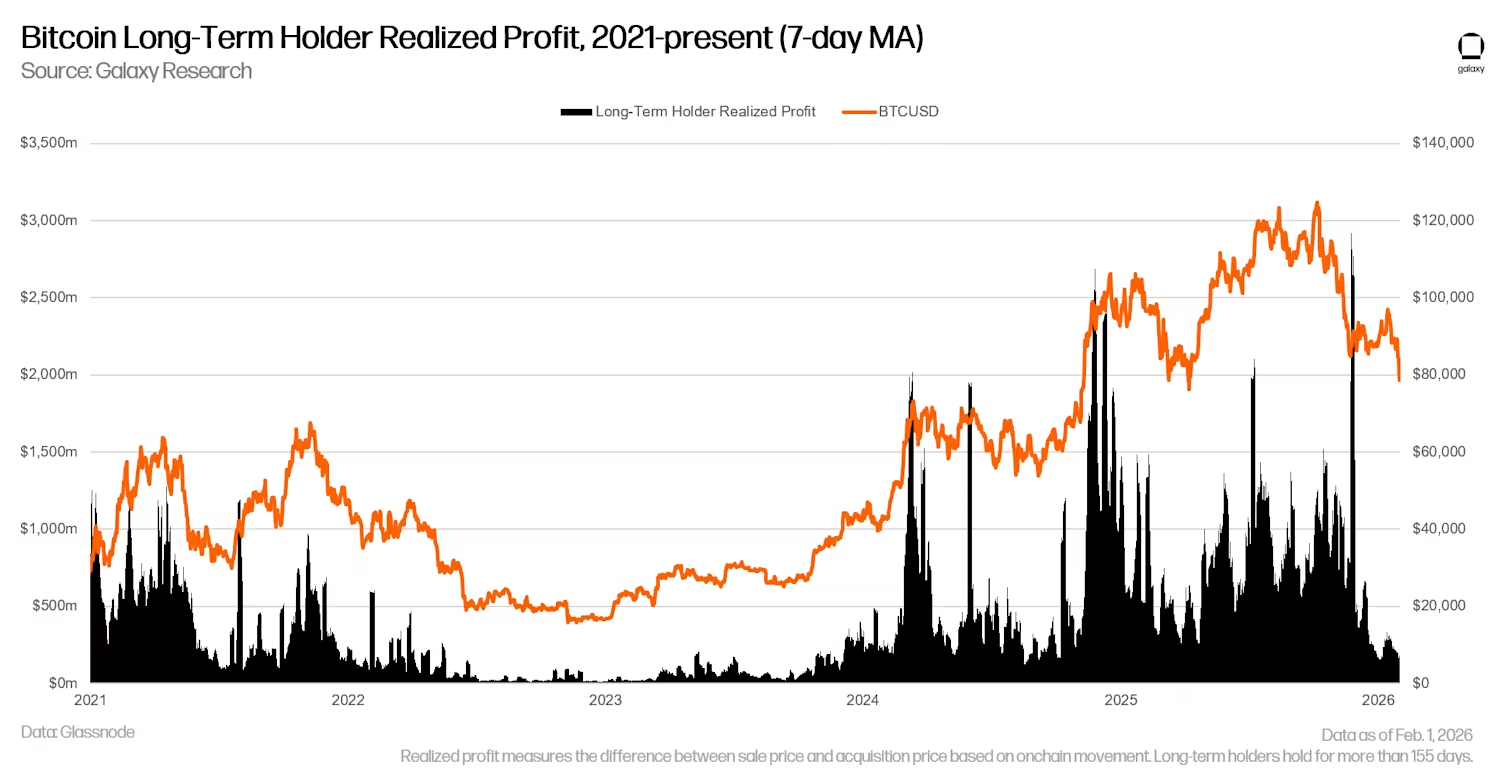
By converting BTCUSD to a linear trend and expanding the time frame to 2021 to the present, it is clear to see how the selling by long-term holders has created resistance to price increases, and that market bottoms often coincide with a reduction in such profit-taking behavior. Therefore, whenever the selling pressure from long-term holders tends to exhaust, Bitcoin prices have a basis for stabilization or even reversal.
Outlook for the Future
We pointed out at the end of last year that the market environment in 2026 is 'too chaotic' to make a clear prediction of Bitcoin's price at the end of the year. Over the past 45 days, the investment environment has not only failed to clarify but has become even more chaotic. However, for BTCUSD, the current trend has become clearer, and the downward trend has further solidified. The upward momentum in January was blocked below $100,000, and it fell below $80,000 last weekend, forming a new short-term low. Although we still have not seen clear signs of accumulation to confirm that the bottom has been fully formed, the reduction in selling behavior by long-term holders does indicate that their confidence in the current price range is strengthening. If Bitcoin further drops to near the 200-week moving average or realized price, these key support levels have often proven to be attractive entry points for long-term investors and may again provide similar entry opportunities this time.