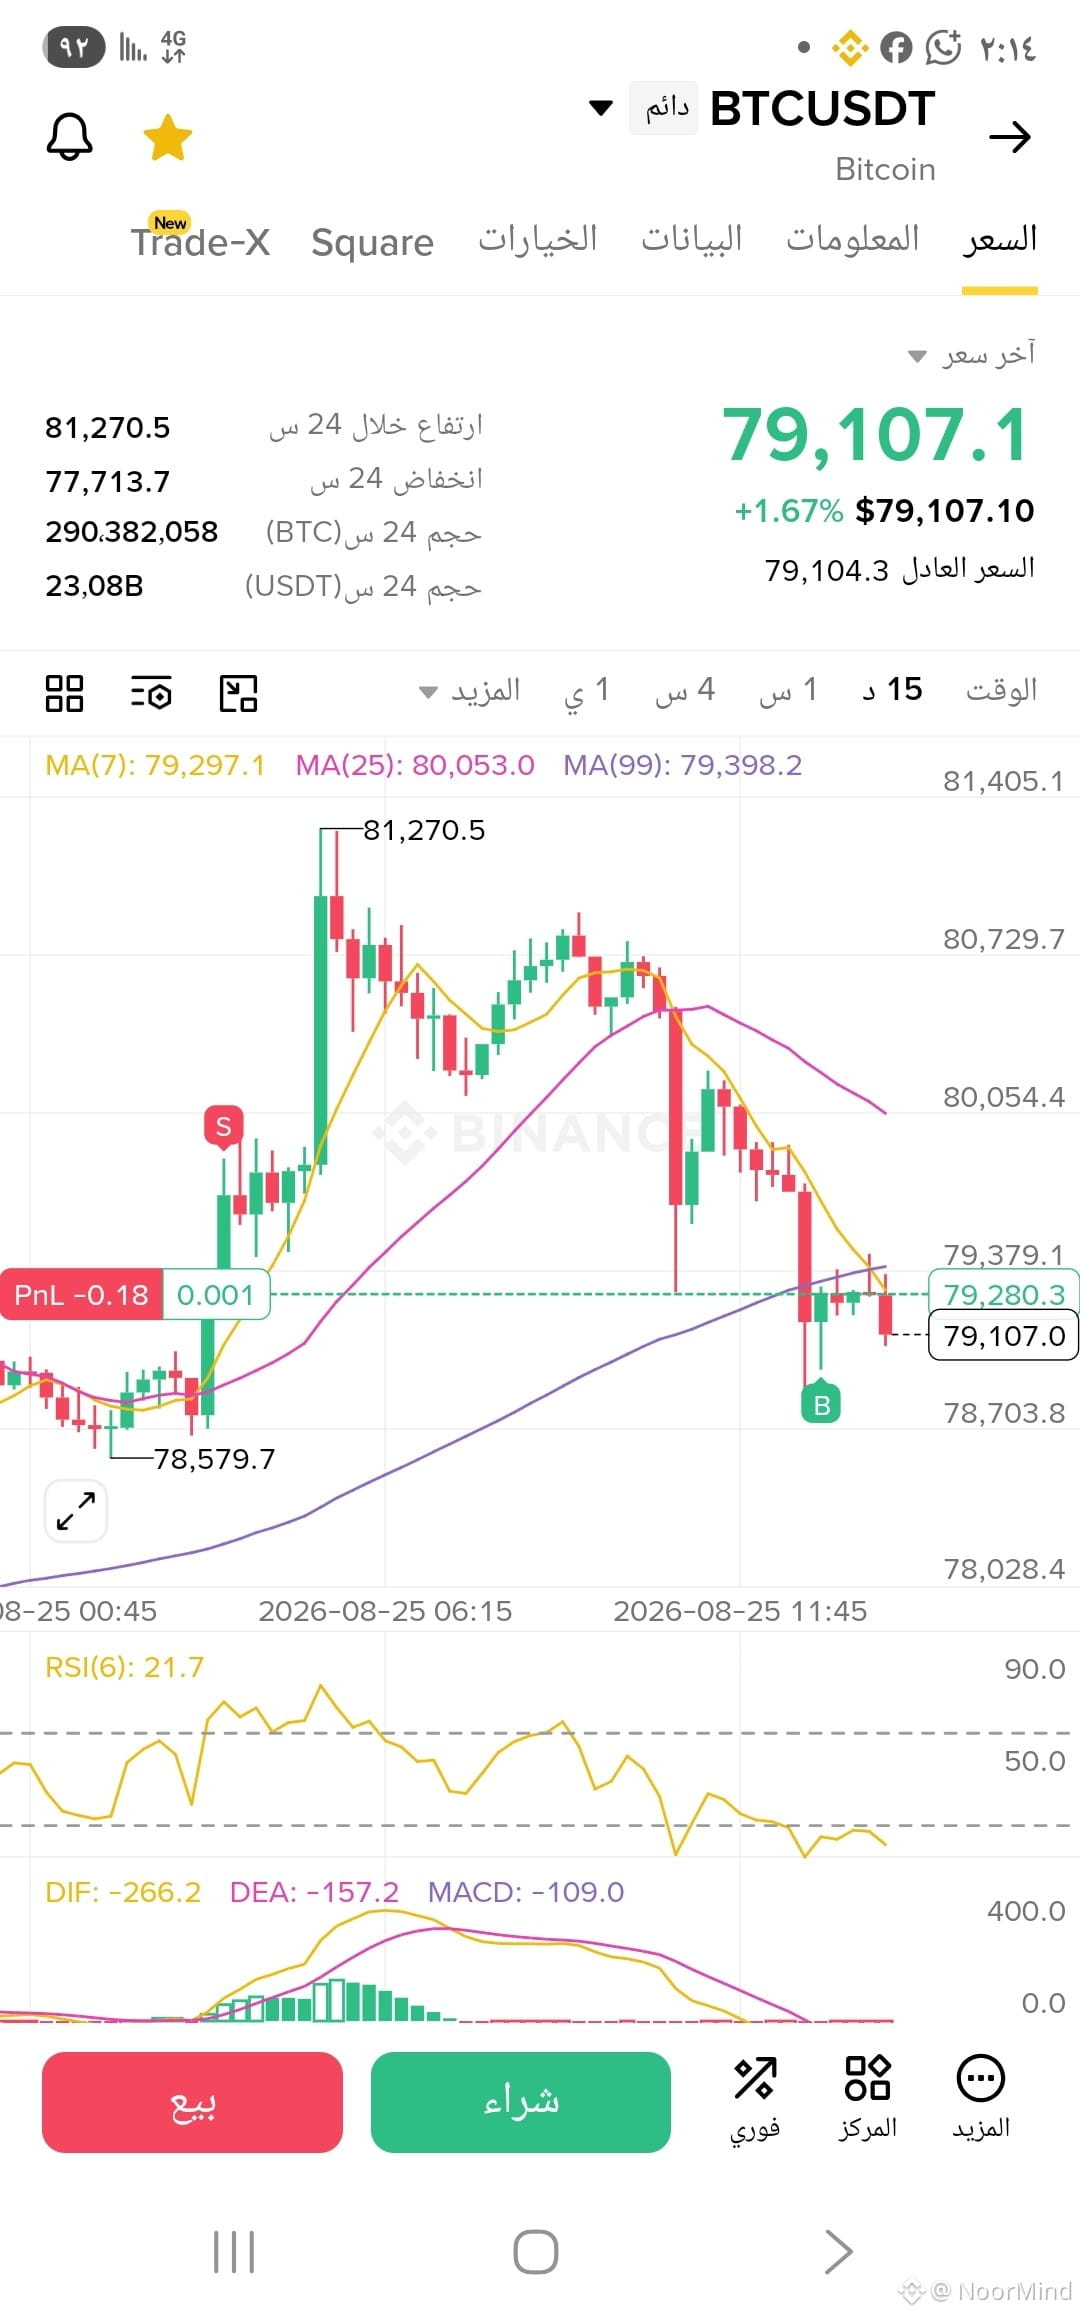
Current Price: The price is moving around the 79,107 level and trading below the short moving averages (MA7 and MA25), which reflects immediate selling pressure.
Relative Strength Index (RSI): It is around 21.7, placing it in the extreme oversold area (Oversold). These zones are often preceded by an upward corrective rebound or a temporary stabilization.
MACD Indicator: The histogram is negative and below the zero line, but the lines are approaching a slowdown, which may indicate the current downtrend wave is nearing its end.
Current Position: As mentioned earlier, your position is a buy (long), which aligns with the price being near support areas and with indicators that are oversold.$BTC
Relative Strength Index (RSI): It is around 21.7, placing it in the extreme oversold area (Oversold). These zones are often preceded by an upward corrective rebound or a temporary stabilization.
MACD Indicator: The histogram is negative and below the zero line, but the lines are approaching a slowdown, which may indicate the current downtrend wave is nearing its end.
Current Position: As mentioned earlier, your position is a buy (long), which aligns with the price being near support areas and with indicators that are oversold.$BTC