$BTC 📉 Has the momentum ended? BTC’s institutional chart points to a sharp
correction
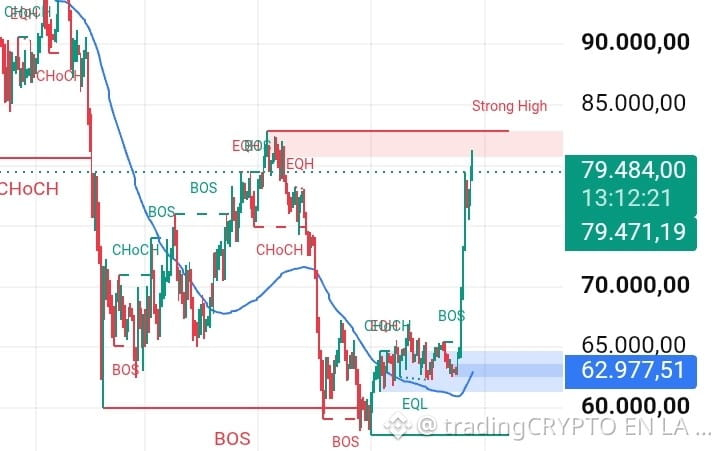
Bitcoin (BTC) is currently trading around $79,484.00, but the institutional price action suggests retail buyers may be getting caught in a liquidity trap. After a strong bullish rally, the price has reached a crucial macro resistance zone:⚠️ The Technical Red Flags on the Chart:Internal Liquidity Sweep: Price surged aggressively in a vertical move, but has just slammed directly into the zone of a Strong High (swing high) just below $85,000.00, where a bearish order block sits.Lack of Structural Continuation: Despite the rise, the prior structure had been showing bearish breaks in structure (CHoCH / Change of Character) and breaks of structural support (BOS / Break of Structure), leaving a huge inefficiency below.The Liquidity Calling to Price: The vertical climb created an enormous liquidity void. The real institutional demand isn’t up here; it’s well below, concentrated in the support block (buyer Order Block) painted in blue in the $60,000.00 - $63,000.00 range, where the equal lows (EQL) rest.💡 Conclusion: The most likely scenario in terms of statistical probability is a rejection in this upper range to mitigate the imbalances still pending. Price tends to seek out efficient liquidity, and that demand is patiently waiting below.#Bitcoin #Trading #SMC #Crypto #TechnicalAnalysis
correction
Bitcoin (BTC) is currently trading around $79,484.00, but the institutional price action suggests retail buyers may be getting caught in a liquidity trap. After a strong bullish rally, the price has reached a crucial macro resistance zone:⚠️ The Technical Red Flags on the Chart:Internal Liquidity Sweep: Price surged aggressively in a vertical move, but has just slammed directly into the zone of a Strong High (swing high) just below $85,000.00, where a bearish order block sits.Lack of Structural Continuation: Despite the rise, the prior structure had been showing bearish breaks in structure (CHoCH / Change of Character) and breaks of structural support (BOS / Break of Structure), leaving a huge inefficiency below.The Liquidity Calling to Price: The vertical climb created an enormous liquidity void. The real institutional demand isn’t up here; it’s well below, concentrated in the support block (buyer Order Block) painted in blue in the $60,000.00 - $63,000.00 range, where the equal lows (EQL) rest.💡 Conclusion: The most likely scenario in terms of statistical probability is a rejection in this upper range to mitigate the imbalances still pending. Price tends to seek out efficient liquidity, and that demand is patiently waiting below.#Bitcoin #Trading #SMC #Crypto #TechnicalAnalysis