
$PORTAL SHORT — Don’t Let RSI Fool You ⚠️
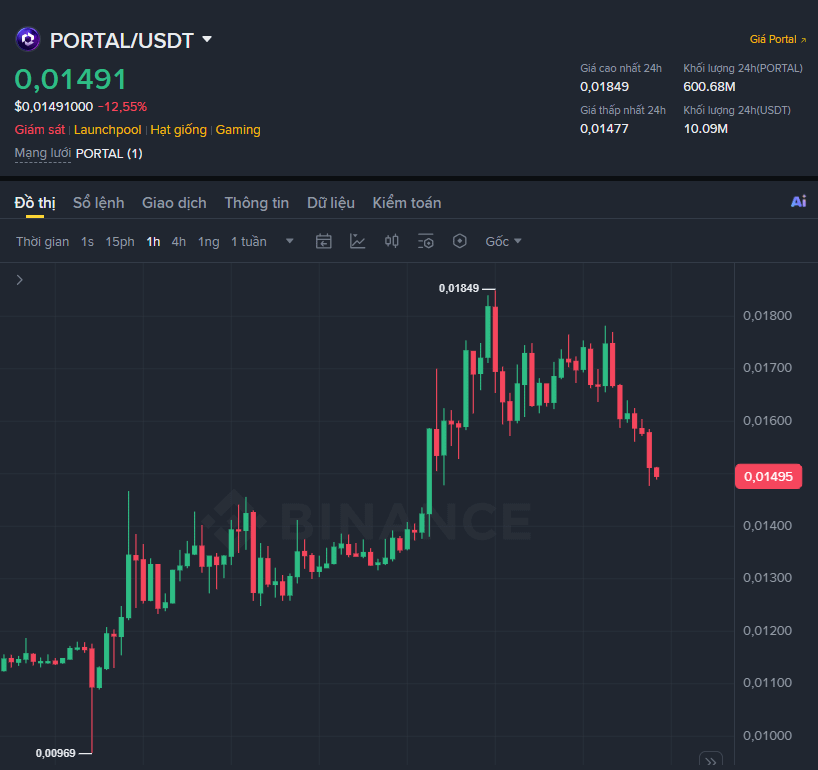
Everyone is looking at the 1D chart, but I pay more attention to the 4H structure of $PORTAL . And currently, this structure is clearly leaning toward the sell side.
🔴 $PORTAL /USDT — SHORT | Conf 88%
📈 Trading plan:
⟶ Entry: 0.01484 – 0.01499
• SL: 0.01680
• TP1: 0.01350
• TP2: 0.01256
• TP3: 0.01115
The noteworthy point is that the 15m RSI is at 26.17—looking at it at face value can easily make many people think: “Oversold, so a bounce is coming soon.”
But I’m not rushing to LONG just because one indicator is oversold.
The 4H timeframe is what I care about. The trend is still in a bearish mode, so if price bounces up into the 0.01485–0.01499 area, this could be the zone where the sell side continues to apply pressure.
The scenario I’m watching is very simple:
➡️ Price retraces back to the Entry zone
➡️ Resistance holds
➡️ 4H momentum continues to weaken
➡️ Targeting 0.01350 → 0.01257 → 0.01115 one by one
The 0.01680 level is the invalidation zone. If price strongly breaks above it, I’ll drop the SHORT scenario instead of stubbornly holding on.
Important question:
The 15m RSI is oversold—does this signal a technical bounce, or is it just a sign that the market is accelerating within the downtrend?
I lean toward the second option, but I won’t FOMO into chasing price. Wait for the right zone, the right structure, then act. 🎯
Everyone is looking at the 1D chart, but I pay more attention to the 4H structure of $PORTAL . And currently, this structure is clearly leaning toward the sell side.
🔴 $PORTAL /USDT — SHORT | Conf 88%
📈 Trading plan:
⟶ Entry: 0.01484 – 0.01499
• SL: 0.01680
• TP1: 0.01350
• TP2: 0.01256
• TP3: 0.01115
The noteworthy point is that the 15m RSI is at 26.17—looking at it at face value can easily make many people think: “Oversold, so a bounce is coming soon.”
But I’m not rushing to LONG just because one indicator is oversold.
The 4H timeframe is what I care about. The trend is still in a bearish mode, so if price bounces up into the 0.01485–0.01499 area, this could be the zone where the sell side continues to apply pressure.
The scenario I’m watching is very simple:
➡️ Price retraces back to the Entry zone
➡️ Resistance holds
➡️ 4H momentum continues to weaken
➡️ Targeting 0.01350 → 0.01257 → 0.01115 one by one
The 0.01680 level is the invalidation zone. If price strongly breaks above it, I’ll drop the SHORT scenario instead of stubbornly holding on.
Important question:
The 15m RSI is oversold—does this signal a technical bounce, or is it just a sign that the market is accelerating within the downtrend?
I lean toward the second option, but I won’t FOMO into chasing price. Wait for the right zone, the right structure, then act. 🎯