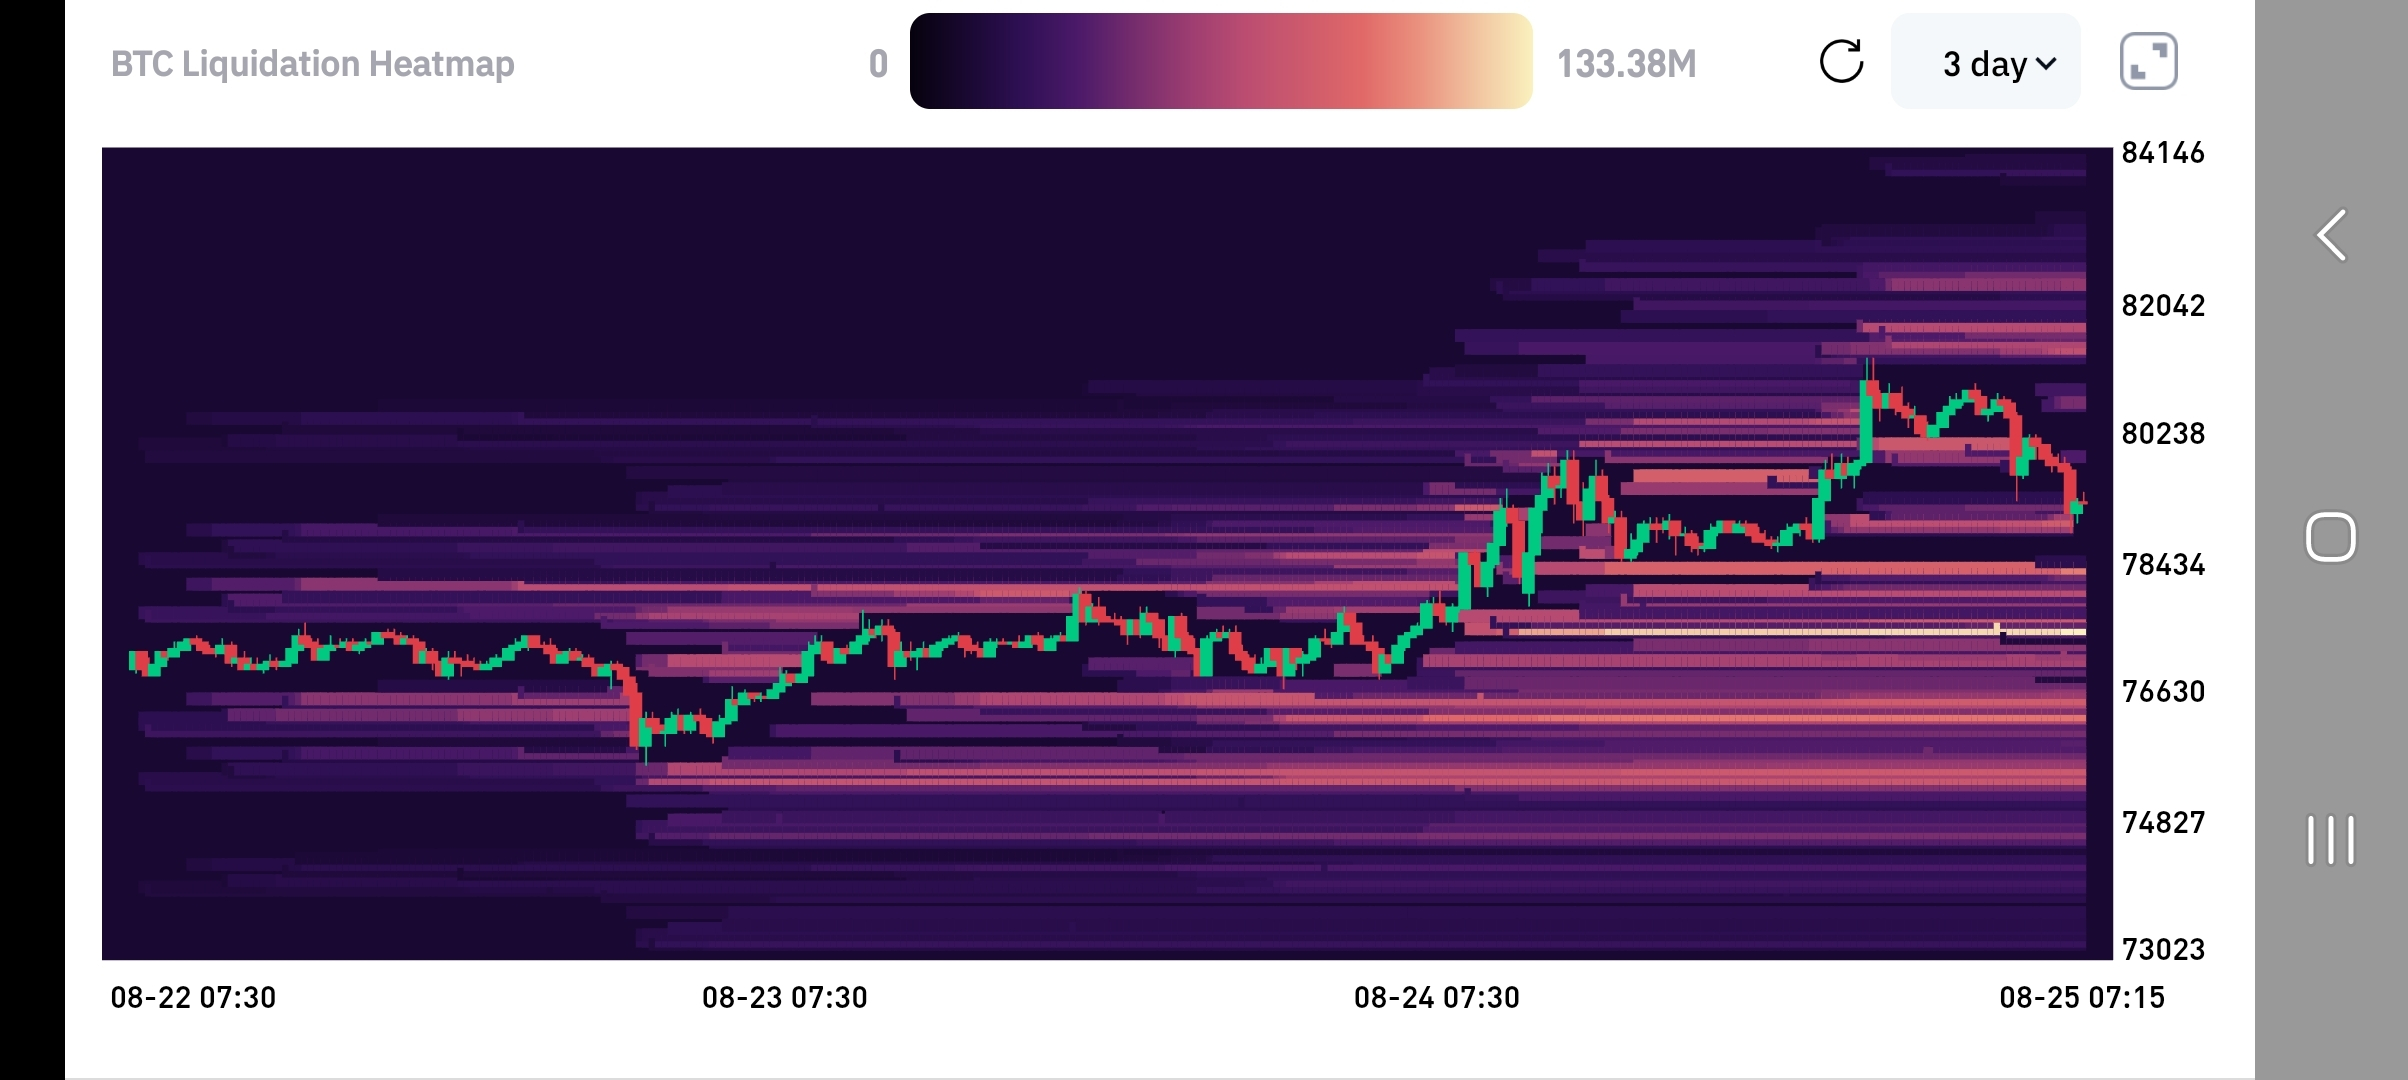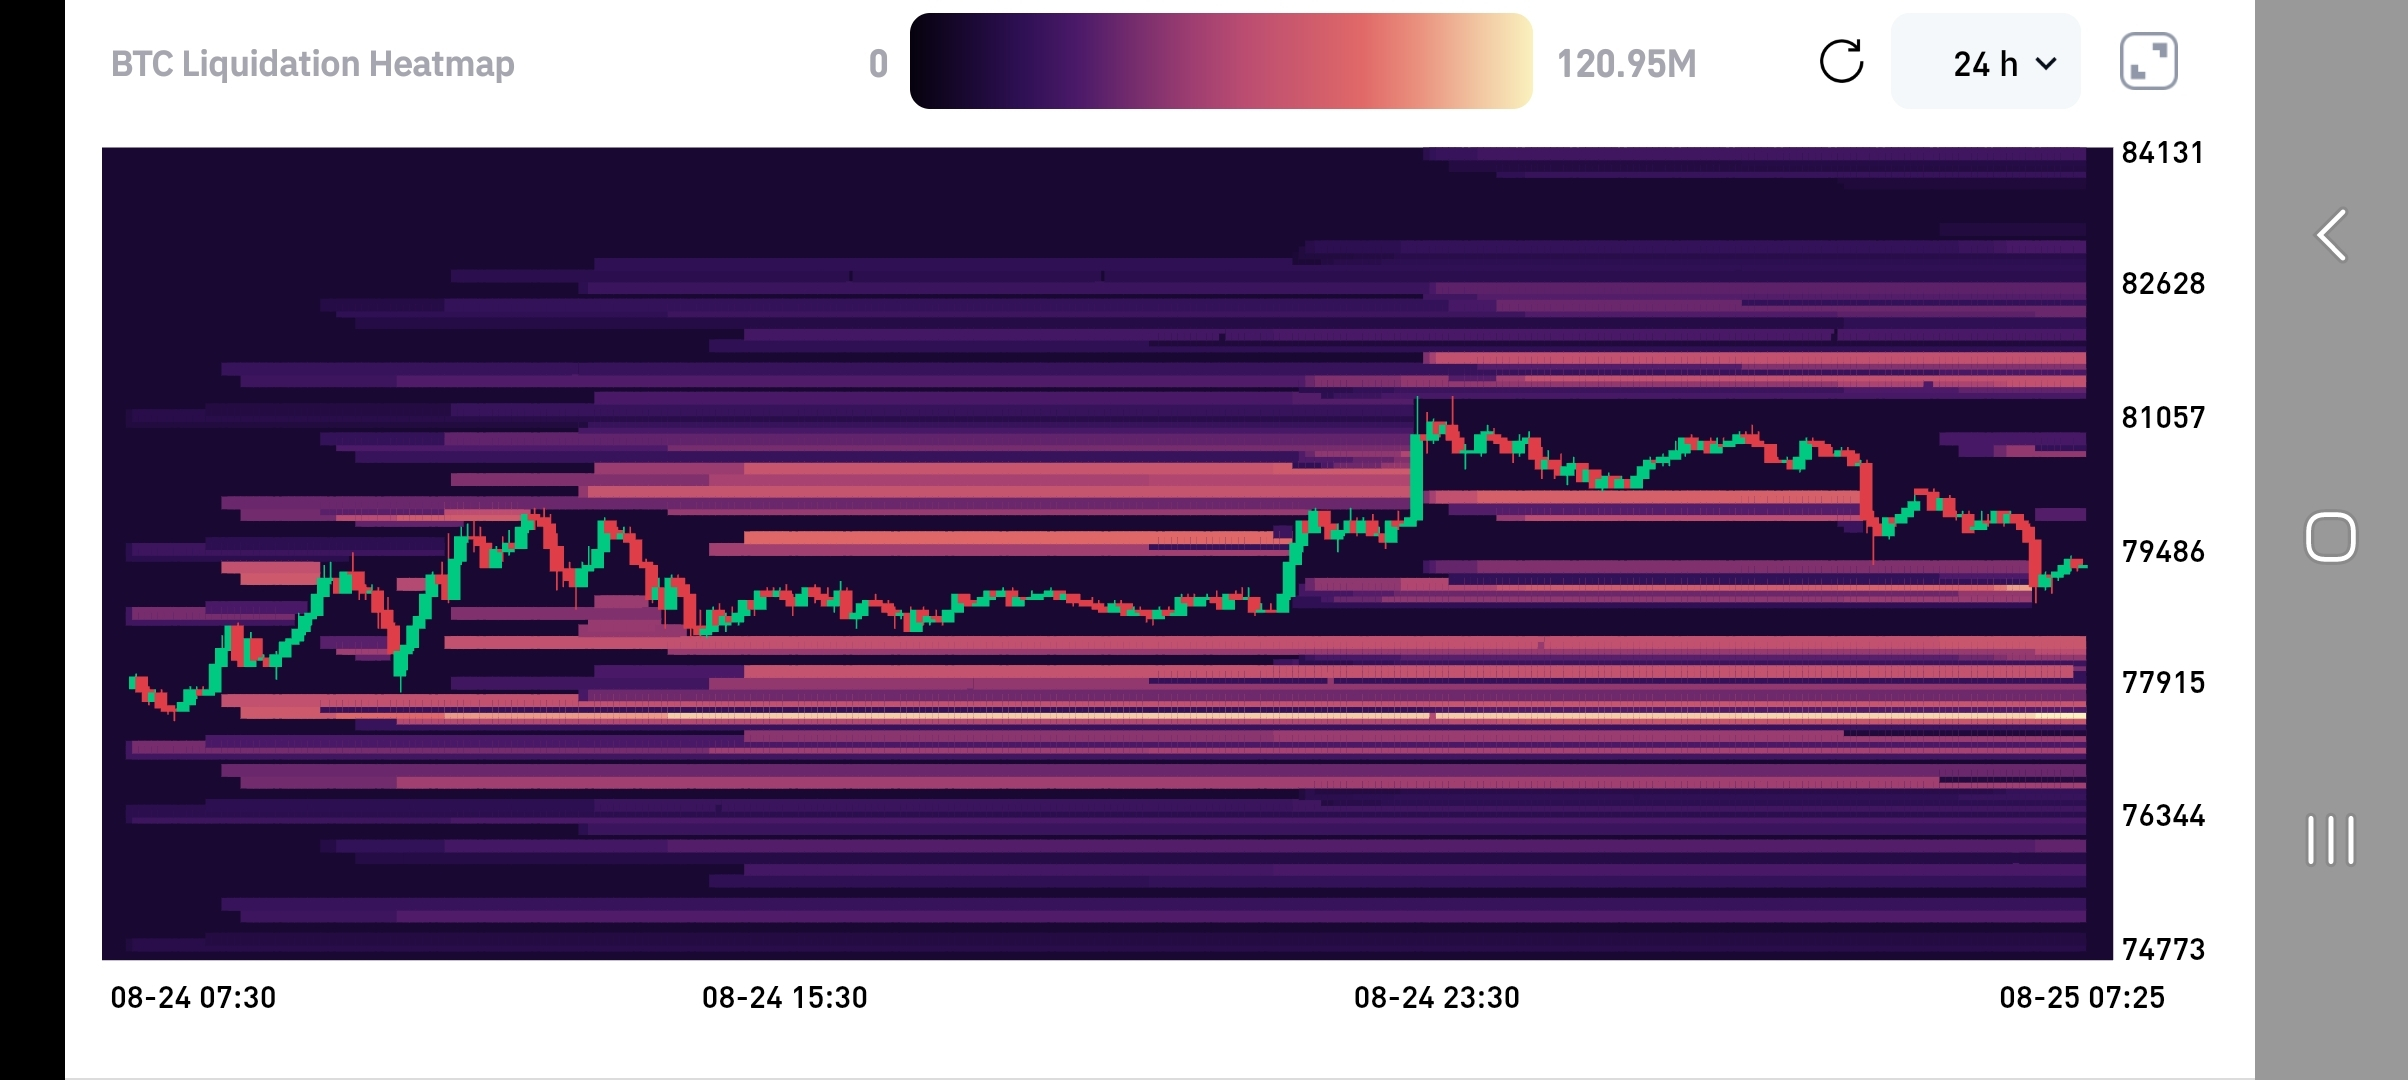

Yes. Looking at this specific 3-day chart, the reading is pretty clear: BTC is entering an area where there’s significant liquidity both above and below, but in the short term the structure favors a first move to search for higher liquidity.
What you see on the chart
The price in the screenshot is around USD 79,000–79,500.
Up:
USD 80,200–81,000: there’s a significant concentration of liquidations.
USD 81,500–82,500: there’s another fairly loaded zone.
USD 83,000–84,000: liquidity shows up again, although farther away.
That means that if BTC reclaims 80.200–80.500 strongly, a cascade of liquidations of short positions can happen and accelerate the move toward 81.500–82.500. Short liquidations create forced buys, which can fuel the momentum.
Below:
USD 78.400–77.800: first relevant zone.
USD 77.000–76.500: a fairly thicker liquidity pocket appears.
USD 75.000–74.800: there’s another important accumulation.
And here's what's interesting: if it loses 78.400, the map starts opening a path toward the 77.000–76.500 zone. If that zone also doesn't hold, the cascade could deepen toward 75.000.
🧠 My read
I'd summarize it like this:
BTC is trapped between two liquidity pockets.
84.000 ───── 🔥 liquidity
82.500 ───── 🔥🔥
81.500 ───── 🔥🔥🔥
80.500 ───── 🔥🔥🔥 ← immediate zone above
79.000 ───── BTC NOW
78.400 ───── ⚠️
77.000 ───── 🔥🔥🔥
76.500 ───── 🔥🔥🔥🔥 ← strong zone below
75.000 ───── 🔥🔥
The peculiarity is that BTC has just surged with a lot of strength. In fact, today it was reported that it surpassed USD 80,000 and that the move triggered more than USD 220 million in short liquidations over 24 hours.
That's why, Marlon, I'd be very careful about interpreting the map as “BTC necessarily is going to go up”. The 80–82k zone can act like a magnet, but it can also be exactly where the market does a sweep of shorts and then dumps.
And there’s one piece of data that I think is especially important: a market source currently places USD 81.500–83.000 as resistance, while USD 77.500–78.500 appears as a relevant liquidation pocket if BTC loses the 80K.
In neighborhood Spanish: first I'd look at what BTC does around 80.200–80.500. If it enters, breaks, and holds, the next fight is up at 81.500–82.500. If it taps that area and gets strongly rejected, then 78.400 is the first warning and 76.500 is the level I'd watch very closely.
Note: the heatmap shows estimated liquidation zones, not guaranteed orders; by itself it doesn't indicate where BTC will go. It's best to read it together with price, volume, and open interest.