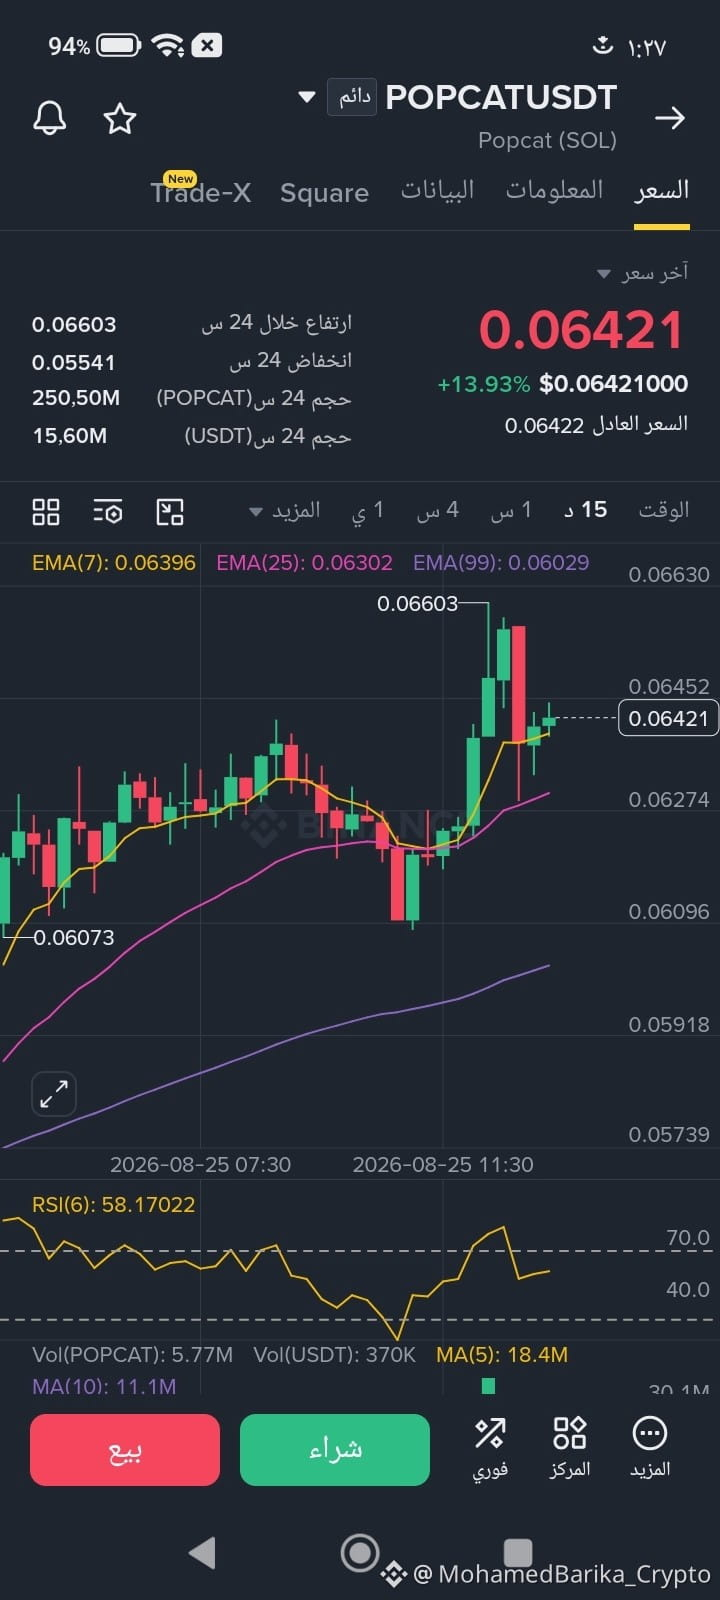
$POPCAT All eyes are on the major fluctuations, but this 1-hour timeframe signal for POPCAT/USDT confirms the continuation of strong bullish momentum and price stability above the moving averages, after registering a gain of over 13.93% and testing a base/turning point at $0.06073! 🚀
LONG 🟢 - POPCAT$
Trading Plan:
Entry: 0.06300 – 0.06421
SL (Stop Loss): 0.05980
TP1: 0.06800
TP2: 0.07200
TP3: 0.07600
Why this setup?
The price is testing strong levels at $0.06421 amid notable activity and trading volume of about $15.60 million (and over 24 hours, $250.50 million), reflecting buyers’ dominance and their support for the uptrend after the bounce from the $0.06073 bottom.
RSI indicator (on the 1H timeframe) is at 58.17, showing balanced buying control and strong momentum that supports continuation of the rise toward prior resistances.
Moving Average Convergence (EMA) is clearly positive, with EMA(7) moving at 0.06396 above EMA(25) and EMA(99), supporting the continuation of bullish momentum.
Why now? The current entry zone represents an excellent pivot base to capture a new bullish wave toward the sequential targets.
Discussion:
Will the price break through the resistance level and strongly surpass the high at $0.06603, or will we see a temporary profit-taking pullback? Who’s with us on this trade?
Click here to trade 👇
$NVDAB $NVDA.US #KOSPI200NightFuturesFall1.77% #OilHoldsLosses #SamsungSKHynixLeveragedETFsPostFirstMonthlyOutflow #SKHynixFalls5.63%AfterUnionRejectsWageDeal
LONG 🟢 - POPCAT$
Trading Plan:
Entry: 0.06300 – 0.06421
SL (Stop Loss): 0.05980
TP1: 0.06800
TP2: 0.07200
TP3: 0.07600
Why this setup?
The price is testing strong levels at $0.06421 amid notable activity and trading volume of about $15.60 million (and over 24 hours, $250.50 million), reflecting buyers’ dominance and their support for the uptrend after the bounce from the $0.06073 bottom.
RSI indicator (on the 1H timeframe) is at 58.17, showing balanced buying control and strong momentum that supports continuation of the rise toward prior resistances.
Moving Average Convergence (EMA) is clearly positive, with EMA(7) moving at 0.06396 above EMA(25) and EMA(99), supporting the continuation of bullish momentum.
Why now? The current entry zone represents an excellent pivot base to capture a new bullish wave toward the sequential targets.
Discussion:
Will the price break through the resistance level and strongly surpass the high at $0.06603, or will we see a temporary profit-taking pullback? Who’s with us on this trade?
Click here to trade 👇
$NVDAB $NVDA.US #KOSPI200NightFuturesFall1.77% #OilHoldsLosses #SamsungSKHynixLeveragedETFsPostFirstMonthlyOutflow #SKHynixFalls5.63%AfterUnionRejectsWageDeal