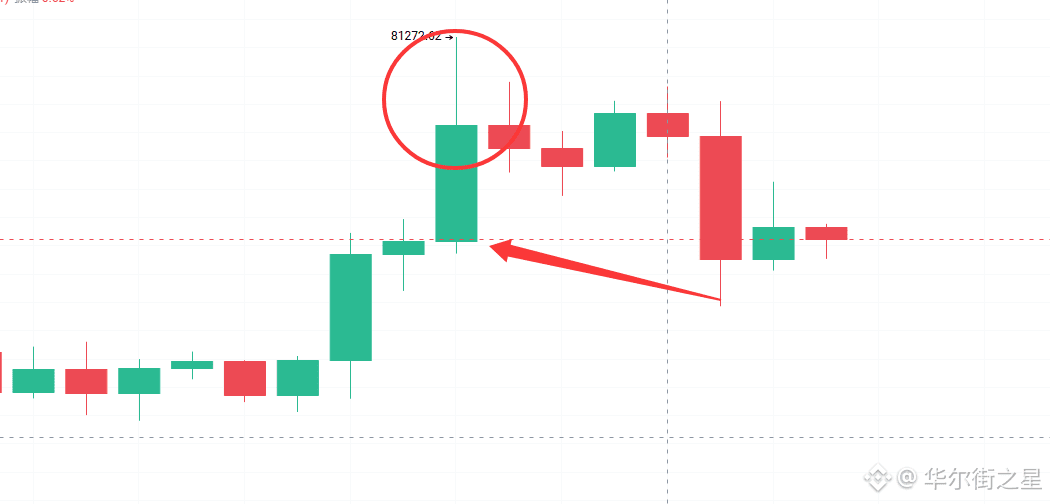
Although the $BTC big cake broke through 80000 and even 81270, afterwards we can clearly see that it did not manage to hold above 81000 or even 80000, which indicates that the sell pressure above 81000 is too heavy.
From the candlestick chart, there is a long upper shadow followed by a bullish close, indicating severe sell pressure above. Afterwards, it broke below the bottom of the bullish candle, and at present it seems that the attempt to push higher has failed.
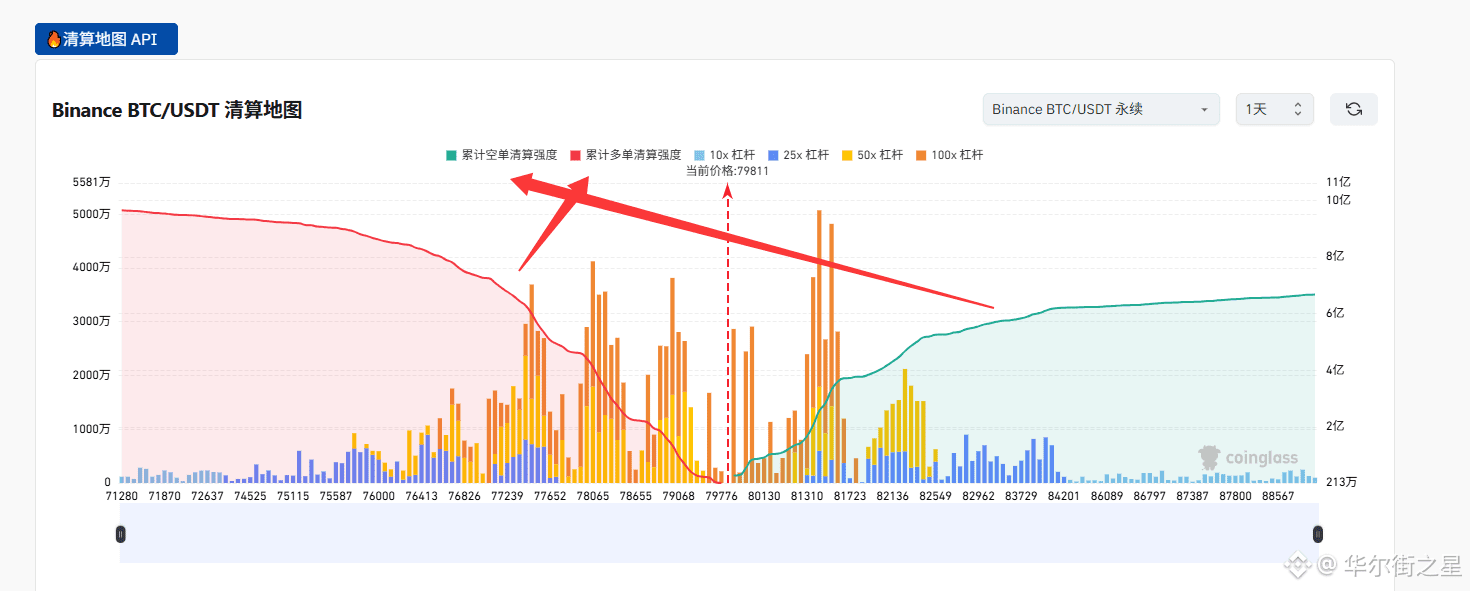
From Figure 2, there is a red line and a green line; on the horizontal level you can see that the red line is higher than the green line, which shows that the long-buying capital in the market is greater than the short-selling capital.
If long positions are liquidated in large numbers, then it will lead to overcrowding on the long side. In the short term, it may cause a drop, but we can infer that once the market’s long leverage has been liquidated and the shorts have the advantage, it will be easy to trigger a rebound wave.#BTCReaches$80000
From the candlestick chart, there is a long upper shadow followed by a bullish close, indicating severe sell pressure above. Afterwards, it broke below the bottom of the bullish candle, and at present it seems that the attempt to push higher has failed.
From Figure 2, there is a red line and a green line; on the horizontal level you can see that the red line is higher than the green line, which shows that the long-buying capital in the market is greater than the short-selling capital.
If long positions are liquidated in large numbers, then it will lead to overcrowding on the long side. In the short term, it may cause a drop, but we can infer that once the market’s long leverage has been liquidated and the shorts have the advantage, it will be easy to trigger a rebound wave.#BTCReaches$80000