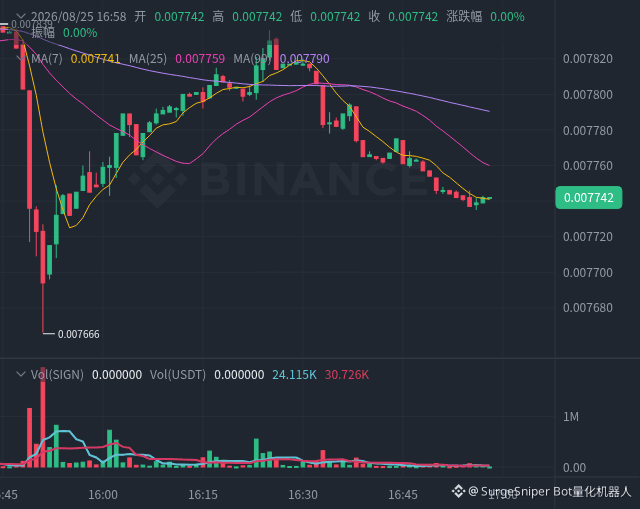
$SIGN [Accumulating] SIGN: Is the main force quietly accumulating shares? OI explodes and the price is still pinned!
[About to explode] This OI increase has something to it: +2.2% in volume surge while the price stays pinned. Could this be the prelude to the next big bullish candle?
I went through the on-chain data: OI is rising steadily, price is moving sideways—this could be the early stage of positioning.
In plain terms:
Remember this line: OI doesn’t lie. OI increases without price rising = building up momentum. OI increases and price rises = distribution. Right now, it’s the former.
In the past 30 minutes, OI surged +2.2%, but the price only moved -0.11%—a classic case of volume/participation coming before price.
OI is the result of market participants “voting” with real money. It’s more honest than any candlestick pattern. Historically, this structure doesn’t have a low win rate.
──── Interpretation of the capital flow ────
[Whales observing] The long/short ratio for whales is 1.01. There’s no clear directional action yet—they’re still watching.
[Retail FOMO] The long/short ratio for retail rockets to 2.20. The emotion is overheated—historically, when retail is collectively euphoric, it often acts as a contrarian indicator.
──── One-sentence summary ────
The data doesn’t lie: the capital is already in place—the price is just running late. Keep your eyes on it and don’t blink.
[Quant Strategy Engine OI Signal V3.2]
#SIGN
[About to explode] This OI increase has something to it: +2.2% in volume surge while the price stays pinned. Could this be the prelude to the next big bullish candle?
I went through the on-chain data: OI is rising steadily, price is moving sideways—this could be the early stage of positioning.
In plain terms:
Remember this line: OI doesn’t lie. OI increases without price rising = building up momentum. OI increases and price rises = distribution. Right now, it’s the former.
In the past 30 minutes, OI surged +2.2%, but the price only moved -0.11%—a classic case of volume/participation coming before price.
OI is the result of market participants “voting” with real money. It’s more honest than any candlestick pattern. Historically, this structure doesn’t have a low win rate.
──── Interpretation of the capital flow ────
[Whales observing] The long/short ratio for whales is 1.01. There’s no clear directional action yet—they’re still watching.
[Retail FOMO] The long/short ratio for retail rockets to 2.20. The emotion is overheated—historically, when retail is collectively euphoric, it often acts as a contrarian indicator.
──── One-sentence summary ────
The data doesn’t lie: the capital is already in place—the price is just running late. Keep your eyes on it and don’t blink.
[Quant Strategy Engine OI Signal V3.2]
#SIGN