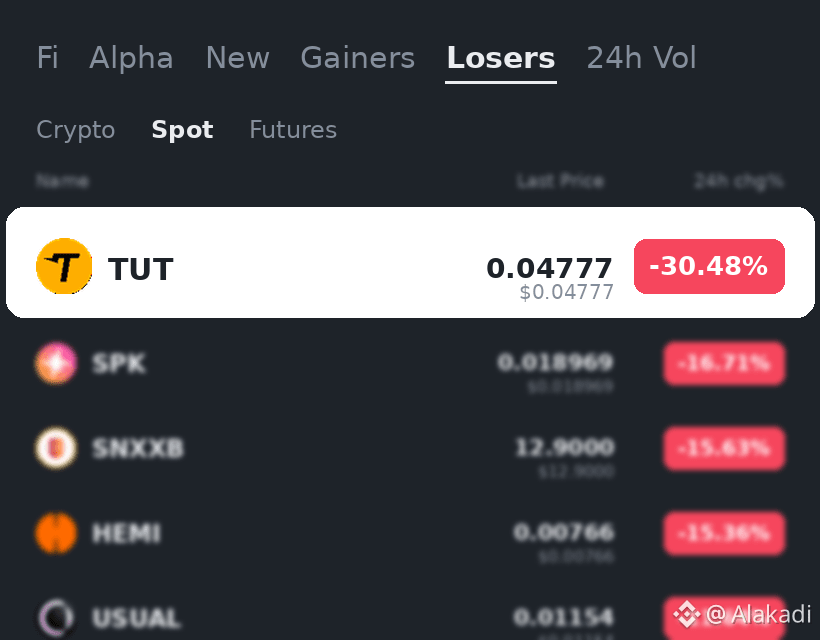
$TUT Bleeding 32% in 24 hours.. but does the 0.13x volume hide a selling trap?
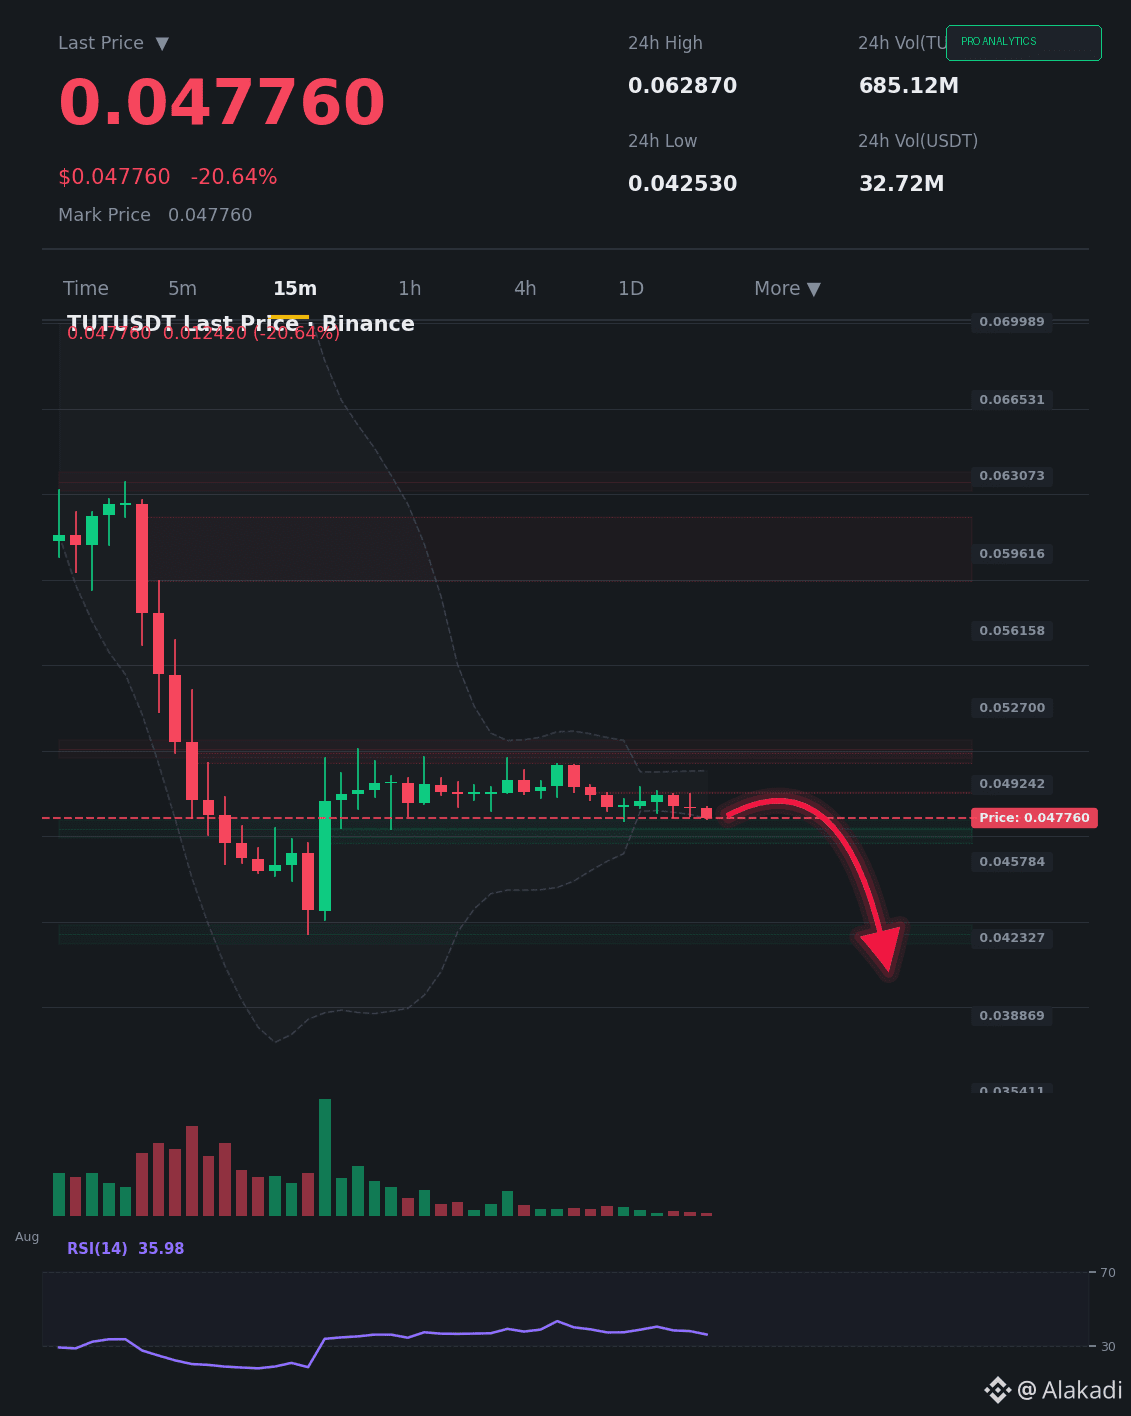
The price at $0.04776 shows a sharp breakdown on the 15-minute chart with frightening liquidity shrinkage. A volume of 0.13 means institutions are completely absent, and the movement is driven by panic selling with no real liquidity support. The RSI is in a severe oversold zone, which raises the likelihood of a violent technical rebound, but without volume confirmation.
The bullish scenario: a breakout above the nearby resistance with volume returning above 1x confirms a “retest of the bottom” and targets 0.052 then 0.058.
The bearish scenario: dead volume keeps pressing the price to break 0.045 and paves the way to 0.038 with little to no support.
The deciding factor: trading volume returning above the 20-period average is the only reliable signal to confirm the bottom.
Do you see this as a doomed breakdown, or a forced liquidation to stop losing positions?
$TUT
This content is not investment advice—do your own research (DYOR)
The price at $0.04776 shows a sharp breakdown on the 15-minute chart with frightening liquidity shrinkage. A volume of 0.13 means institutions are completely absent, and the movement is driven by panic selling with no real liquidity support. The RSI is in a severe oversold zone, which raises the likelihood of a violent technical rebound, but without volume confirmation.
The bullish scenario: a breakout above the nearby resistance with volume returning above 1x confirms a “retest of the bottom” and targets 0.052 then 0.058.
The bearish scenario: dead volume keeps pressing the price to break 0.045 and paves the way to 0.038 with little to no support.
The deciding factor: trading volume returning above the 20-period average is the only reliable signal to confirm the bottom.
Do you see this as a doomed breakdown, or a forced liquidation to stop losing positions?
$TUT
This content is not investment advice—do your own research (DYOR)