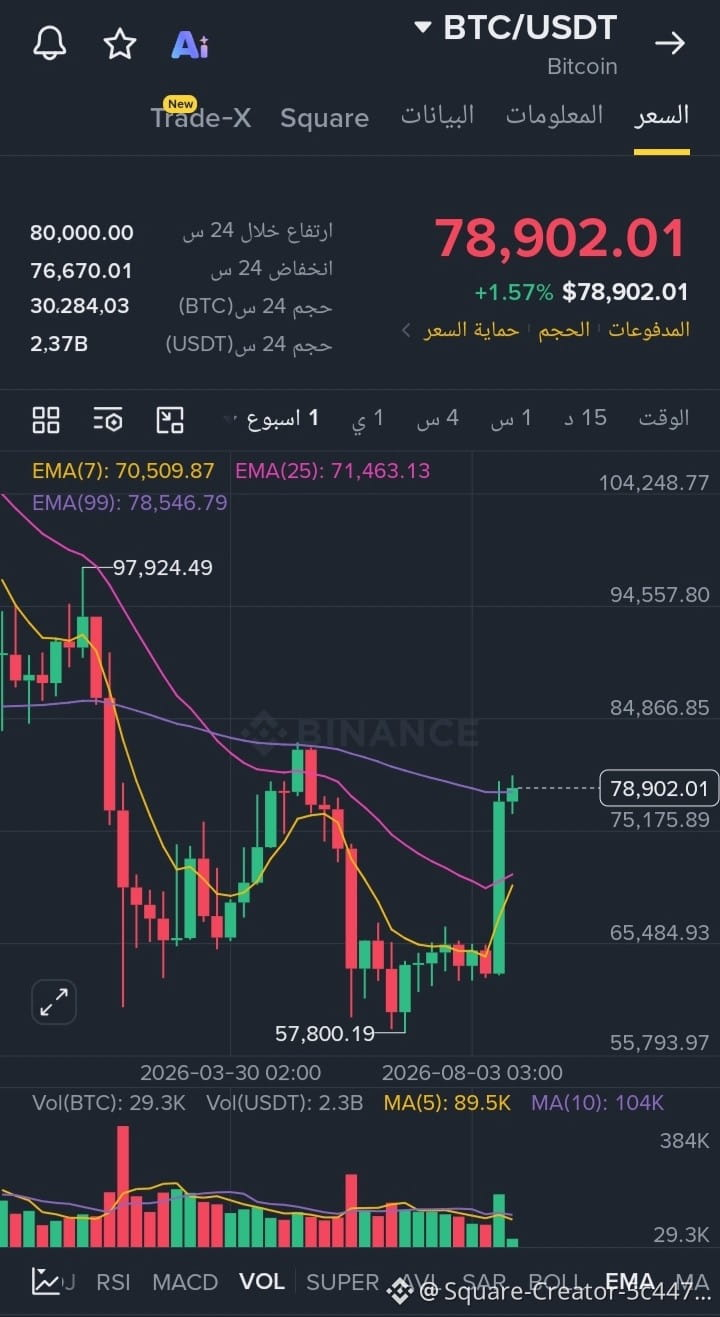
⭐Concise Technical Analysis of the BTC/USDT Pair Based on the Weekly Chart:
🟣Overall Trend: The price is currently trading at 78,902.01 with a strong positive rebound (+1.57%) after forming a bottom at 57,800.19.
🟢Moving Averages: A positive breakout above the EMA(99) at 78,546.79, with trading above EMA(7) and EMA(25), reflects strong upward momentum.
🔵Next Resistance: The price targets the nearby resistance zone at 84,866.85; if it breaks through, it may move toward 94,557.80.
🔴Current Support: Levels of 75,175.89 and then 71,463.13 act as strong support zones to protect the upward trend in case of any pullback.
🟣Overall Trend: The price is currently trading at 78,902.01 with a strong positive rebound (+1.57%) after forming a bottom at 57,800.19.
🟢Moving Averages: A positive breakout above the EMA(99) at 78,546.79, with trading above EMA(7) and EMA(25), reflects strong upward momentum.
🔵Next Resistance: The price targets the nearby resistance zone at 84,866.85; if it breaks through, it may move toward 94,557.80.
🔴Current Support: Levels of 75,175.89 and then 71,463.13 act as strong support zones to protect the upward trend in case of any pullback.