$BTC Bitcoin-circle Academicians: The BTC (Bitcoin) trend for 8.25 has been rewritten—what cycle signals are behind the explosive surge in BTC? Latest market analysis and trading suggestions
Bitcoin’s current price is 79,200. It’s terrifying to miss the move but also terrifying to chase higher and end up buying directly at the top—your mind is in constant turmoil. After a big rally, the two things everyone fears most are: first, impulsively chasing higher—once a pullback comes, you get trapped deeply; second, guessing the top too early and going short—being repeatedly stopped out as the strong trend keeps sweeping losses. Market sentiment has been fully ignited. But the more this is an acceleration phase, the more you cannot trade based on gut feeling. You must rely on chart signals to make a plan, so you don’t get carried away by the sudden surge on the screen.
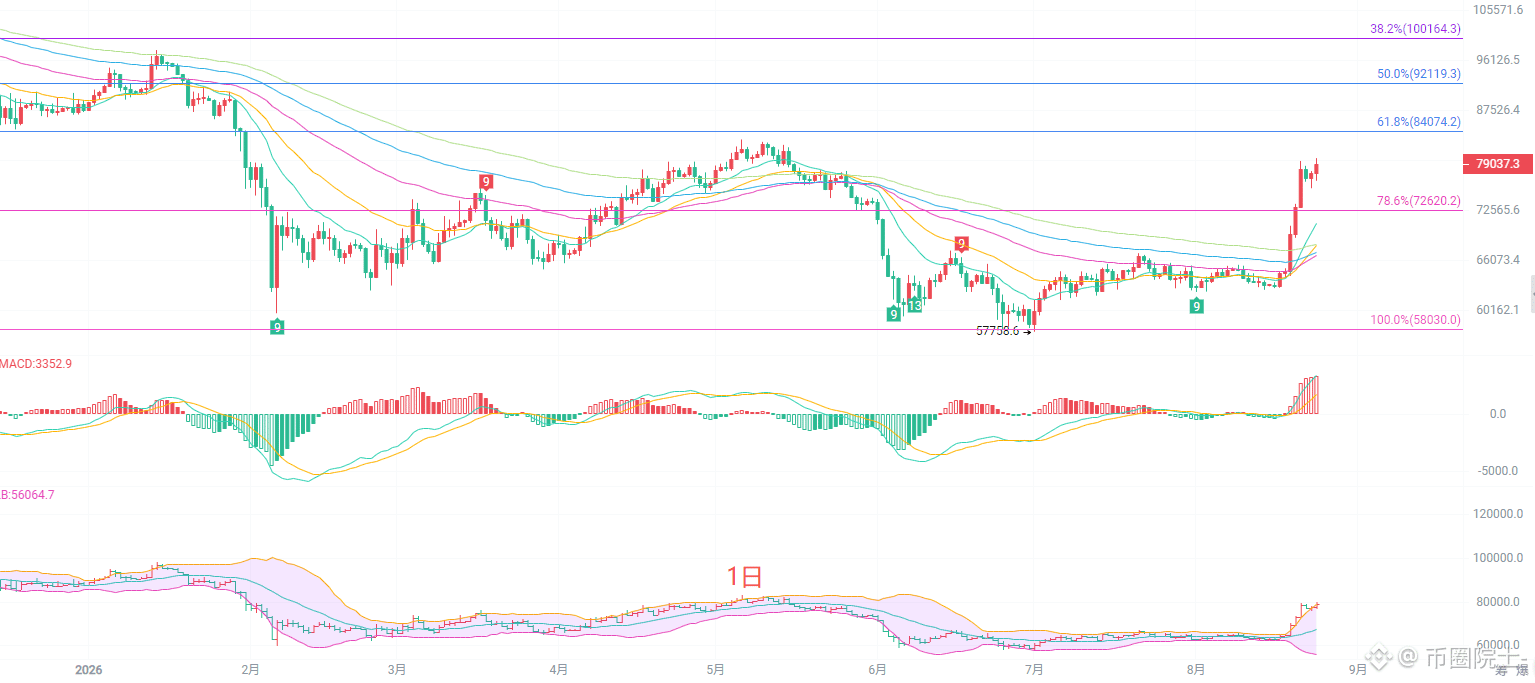
The daily candlestick shows a strong bullish breakout above the prior consolidation range. Price is now above all the EMA moving-average system, and all the moving averages have turned upward—this means the medium-term uptrend has already opened. The Bollinger Bands are widening upward; price is trading outside the upper band. The MACD histogram keeps expanding, fully releasing bullish momentum. On the upside, the first resistance to watch is the 38.2% Fibonacci level at 100,164. On the downside, the key support is the 78.6% Fibonacci pullback level at 72,620. However, after such consecutive big gains, indicators have already entered an overbought zone, and the daily chart likely needs a pullback for correction. Price won’t keep moving straight up in one direction forever. Even if the larger trend is bullish, it’s not suitable to chase at high levels directly. Waiting for a pullback to confirm support is the steadier way to participate.
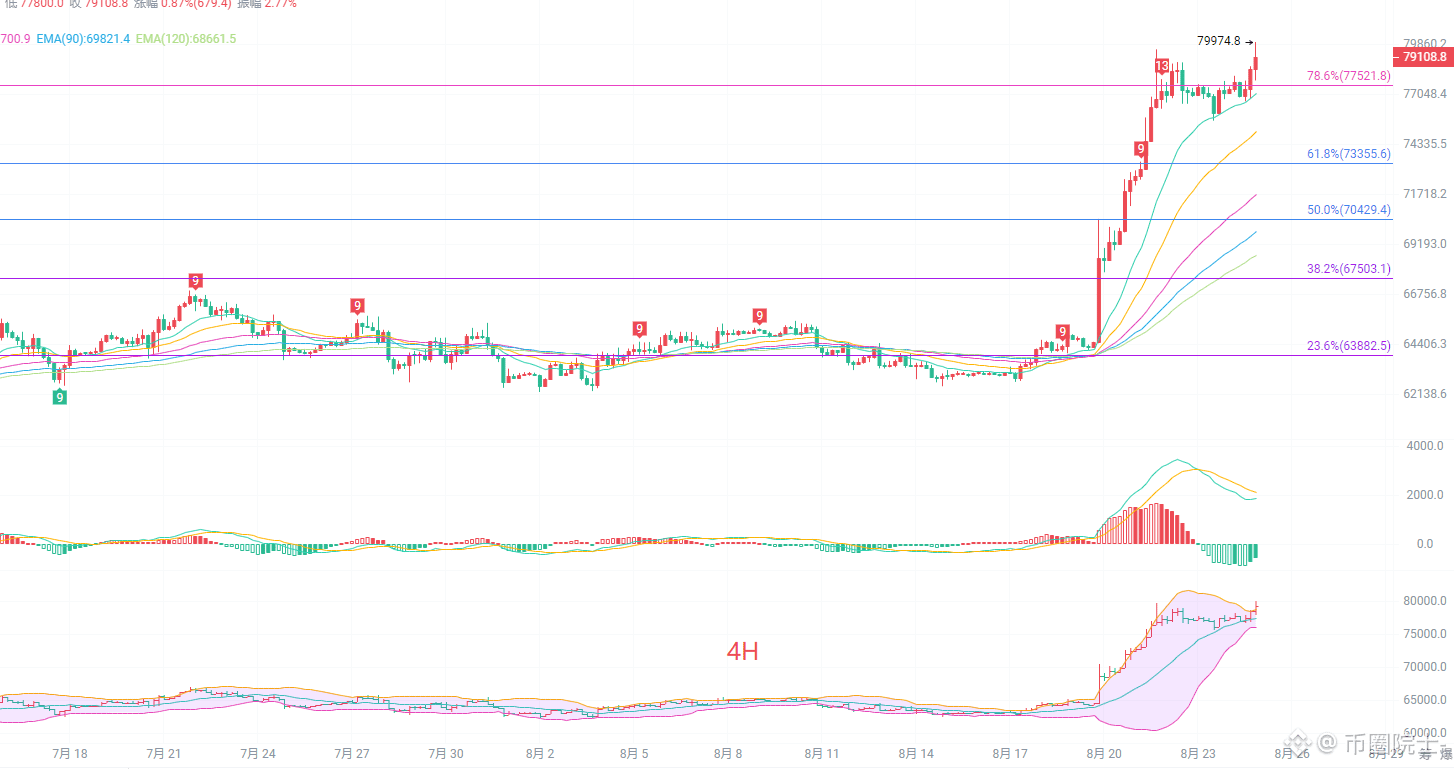
On the four-hour chart, after the rally topped at 79,974, there was a slight pullback. The current price is 79,200. Short-term moving averages remain in a bullish alignment, and price is still moving near the upper band of the Bollinger Bands. But the MACD indicator shows signs of a bearish divergence (top-back divergence): the red histogram continues shrinking, indicating that bullish short-term strength is starting to fade. The 78.6% Fibonacci level at 77,521 has become an important short-term support. The rise on the 4-hour timeframe has been huge, and a large amount of profit-taking positions may trigger pullbacks at any time. While the broader direction hasn’t shown an outright reversal signal, you should not keep chasing higher in the short term. If support holds, the bullish move may continue; if the key support breaks, it will likely trigger a deeper pullback phase.
Short-term reference:
Buy/going long: from 77,500 down to 77,000 as it moves upward. Stop-loss at 76,200. Targets: 82,000 to 85,000.
Sell/going short: from 81,000 to 81,500 moving downward. Stop-loss at 82,600. Targets: 77,500 to 74,000.
Specific execution should be based mainly on real-time order-book data. For more information and details, you can contact the author
#BTC走势分析
Bitcoin’s current price is 79,200. It’s terrifying to miss the move but also terrifying to chase higher and end up buying directly at the top—your mind is in constant turmoil. After a big rally, the two things everyone fears most are: first, impulsively chasing higher—once a pullback comes, you get trapped deeply; second, guessing the top too early and going short—being repeatedly stopped out as the strong trend keeps sweeping losses. Market sentiment has been fully ignited. But the more this is an acceleration phase, the more you cannot trade based on gut feeling. You must rely on chart signals to make a plan, so you don’t get carried away by the sudden surge on the screen.
The daily candlestick shows a strong bullish breakout above the prior consolidation range. Price is now above all the EMA moving-average system, and all the moving averages have turned upward—this means the medium-term uptrend has already opened. The Bollinger Bands are widening upward; price is trading outside the upper band. The MACD histogram keeps expanding, fully releasing bullish momentum. On the upside, the first resistance to watch is the 38.2% Fibonacci level at 100,164. On the downside, the key support is the 78.6% Fibonacci pullback level at 72,620. However, after such consecutive big gains, indicators have already entered an overbought zone, and the daily chart likely needs a pullback for correction. Price won’t keep moving straight up in one direction forever. Even if the larger trend is bullish, it’s not suitable to chase at high levels directly. Waiting for a pullback to confirm support is the steadier way to participate.
On the four-hour chart, after the rally topped at 79,974, there was a slight pullback. The current price is 79,200. Short-term moving averages remain in a bullish alignment, and price is still moving near the upper band of the Bollinger Bands. But the MACD indicator shows signs of a bearish divergence (top-back divergence): the red histogram continues shrinking, indicating that bullish short-term strength is starting to fade. The 78.6% Fibonacci level at 77,521 has become an important short-term support. The rise on the 4-hour timeframe has been huge, and a large amount of profit-taking positions may trigger pullbacks at any time. While the broader direction hasn’t shown an outright reversal signal, you should not keep chasing higher in the short term. If support holds, the bullish move may continue; if the key support breaks, it will likely trigger a deeper pullback phase.
Short-term reference:
Buy/going long: from 77,500 down to 77,000 as it moves upward. Stop-loss at 76,200. Targets: 82,000 to 85,000.
Sell/going short: from 81,000 to 81,500 moving downward. Stop-loss at 82,600. Targets: 77,500 to 74,000.
Specific execution should be based mainly on real-time order-book data. For more information and details, you can contact the author
#BTC走势分析