$BTC $BNB #BTC #Binance
BTC/USDT Technical Analysis 📊
Current Price: $78,546
Timeframe: 1 Minute
24H High: $78,734
24H Low: $76,670
Market Structure
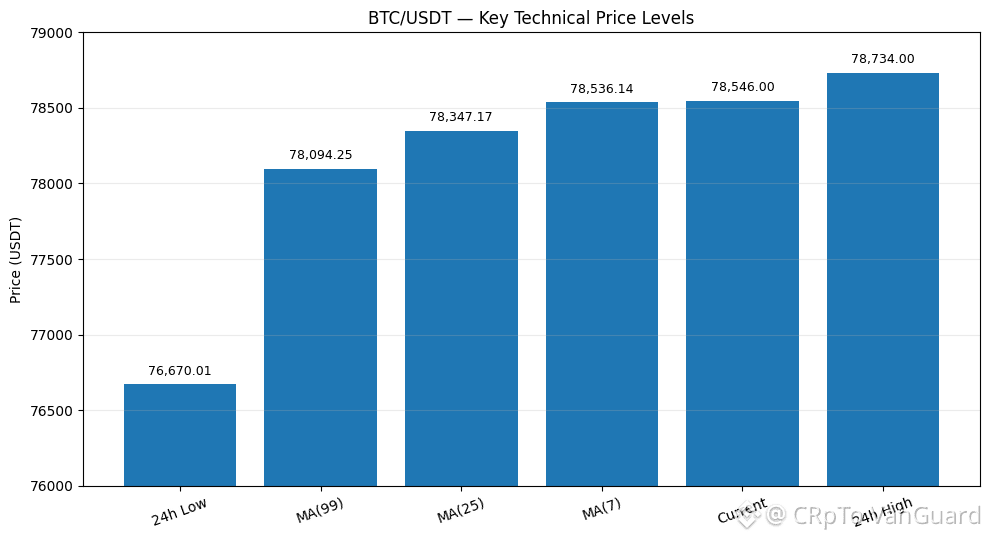
BTC/USDT is showing short-term bullish momentum on the 1-minute chart. The price is currently trading above the MA(25) at $78,347 and MA(99) at $78,094, which indicates that buyers still have short-term control.
The MA(7) is around $78,536, almost equal to the current price, so the immediate direction is at a decision point.
Key Resistance
🔴 $78,734 — Major immediate resistance / recent high.
A strong breakout and 1-minute candle close above $78,734 with good volume could support further upside.
Key Support
🟢 $78,536 — MA(7), immediate support
🟢 $78,347 — MA(25), stronger short-term support
🟢 $78,094 — MA(99), important trend support
Possible Scenarios
Bullish: If BTC breaks and holds above $78,734, the bullish momentum may continue toward higher levels.
Bearish: If price is rejected around $78,700–$78,734 and falls below $78,536, a pullback toward $78,347 becomes possible. A break below $78,347 could expose the $78,094 area.
Conclusion
BTC is currently short-term bullish but facing resistance near $78,734. The most important confirmation is whether price can break and hold above the recent high with increasing volume.
#BTC #Binance
BTC/USDT Technical Analysis 📊
Current Price: $78,546
Timeframe: 1 Minute
24H High: $78,734
24H Low: $76,670
Market Structure
BTC/USDT is showing short-term bullish momentum on the 1-minute chart. The price is currently trading above the MA(25) at $78,347 and MA(99) at $78,094, which indicates that buyers still have short-term control.
The MA(7) is around $78,536, almost equal to the current price, so the immediate direction is at a decision point.
Key Resistance
🔴 $78,734 — Major immediate resistance / recent high.
A strong breakout and 1-minute candle close above $78,734 with good volume could support further upside.
Key Support
🟢 $78,536 — MA(7), immediate support
🟢 $78,347 — MA(25), stronger short-term support
🟢 $78,094 — MA(99), important trend support
Possible Scenarios
Bullish: If BTC breaks and holds above $78,734, the bullish momentum may continue toward higher levels.
Bearish: If price is rejected around $78,700–$78,734 and falls below $78,536, a pullback toward $78,347 becomes possible. A break below $78,347 could expose the $78,094 area.
Conclusion
BTC is currently short-term bullish but facing resistance near $78,734. The most important confirmation is whether price can break and hold above the recent high with increasing volume.
#BTC #Binance